
AppLovin (APP) Deep Dive: Loved It and still Lovin It
It's difficult to evaluate what's inherently a black-box company, but there are reasons for the bulls to remain convicted.

AppLovin has been my favorite company since I first discovered it in February 2025 when the company came under siege from a wave of short-seller reports and the stock plunged more than 50% from its 52 wk high.
 Stock Plunges After Fuzzy Panda, Culper Short-Seller Reports - Bloomberg")
2025/02/25
 Stock Drops After Muddy Waters Issues Short Report - Bloomberg")
2025/03/27
I initiated my position during that drawdown as I became increasingly convinced that the bear narratives were overstated. The stock eventually re-rated as investors regained confidence in the business, validating much of my belief.
Fast forward today, 50% of my X posts is dedicated to APP… At some point, I might just change my profile intro to AppLovin analysis.
The way APP has sold off again YTD is reminiscent of what happened last year, yet this time driven more by broader software de-rating and systematic basket selling that has pressured high-multiple names across the sector. While I acknowledge that continued basket selling could keep a lid on the stock in the near term, the company is approaching what I view as a critical inflection point, one that would open the platform to all web advertisers for the first time and mark the formal beginning of AppLovin's 2nd growth trajectory at scale.
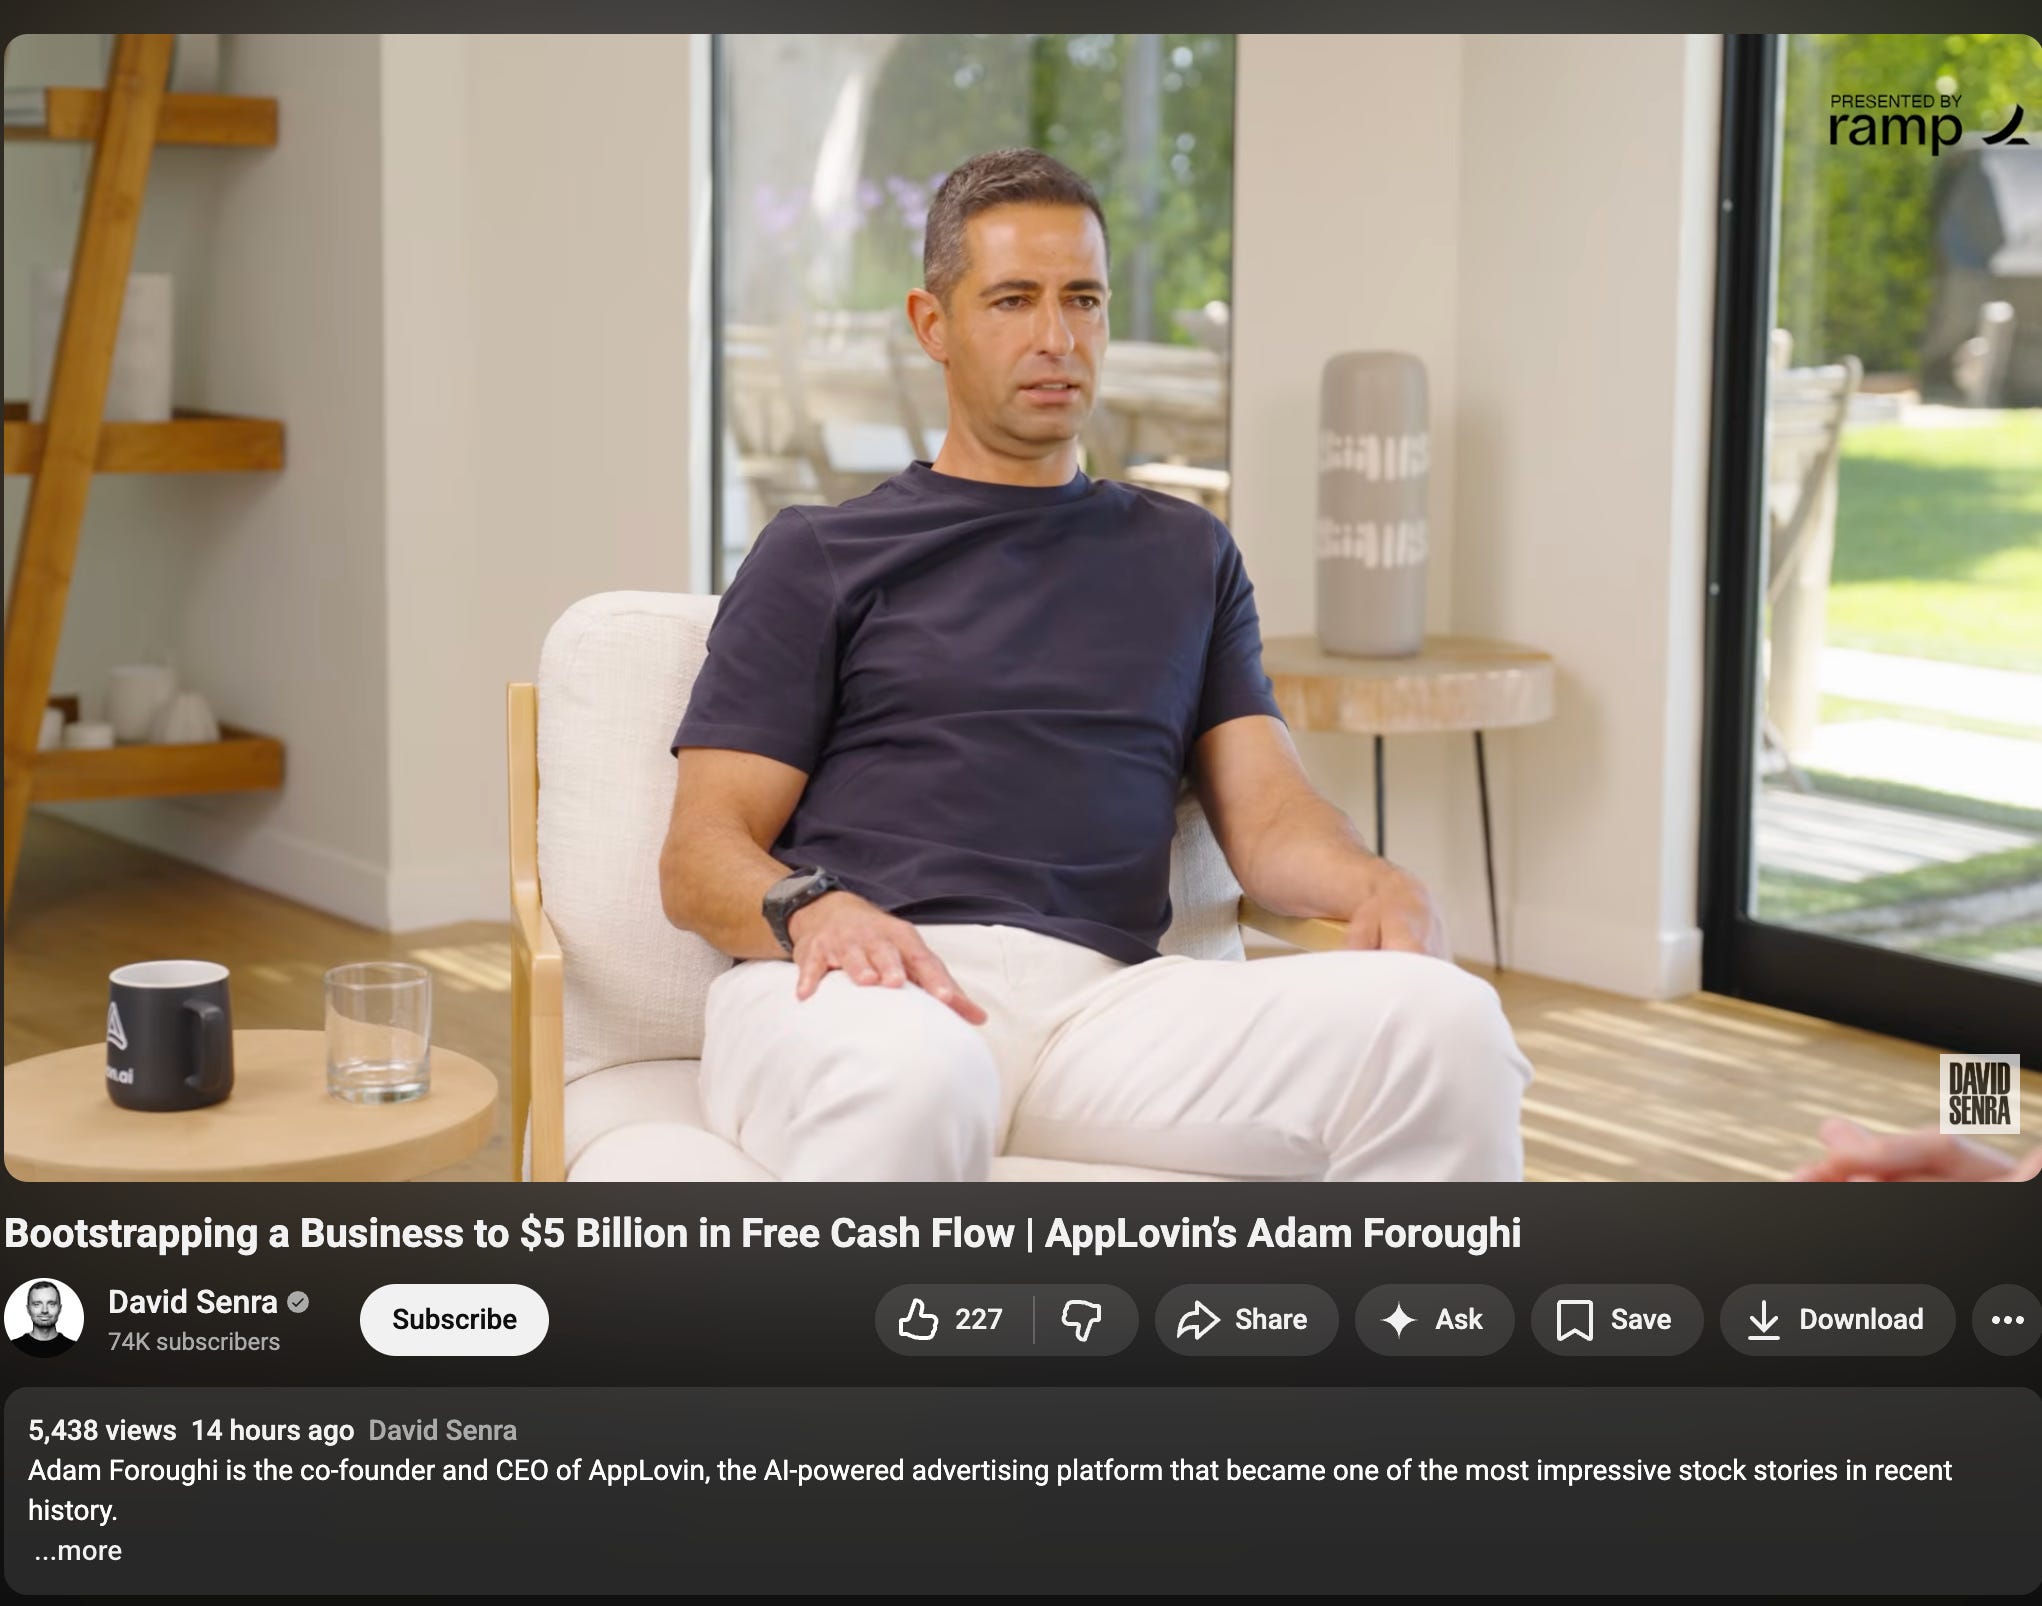
I remain convicted in the company because of Adam Foroughi, the team structure of how they generate billions in EBITDA with only 400 core engineers, and the incredible operating leverage and growth that the business reports year after year. It’s also encouraging to see Adam increasingly engages himself more often in podcasts and social platforms.
For reasons stated above, I want to be positioned in the stock before Applovin reports on May 6th and the GA launch of DTC platform presumably 1H26.
Investment Summary (Your TLDR;)
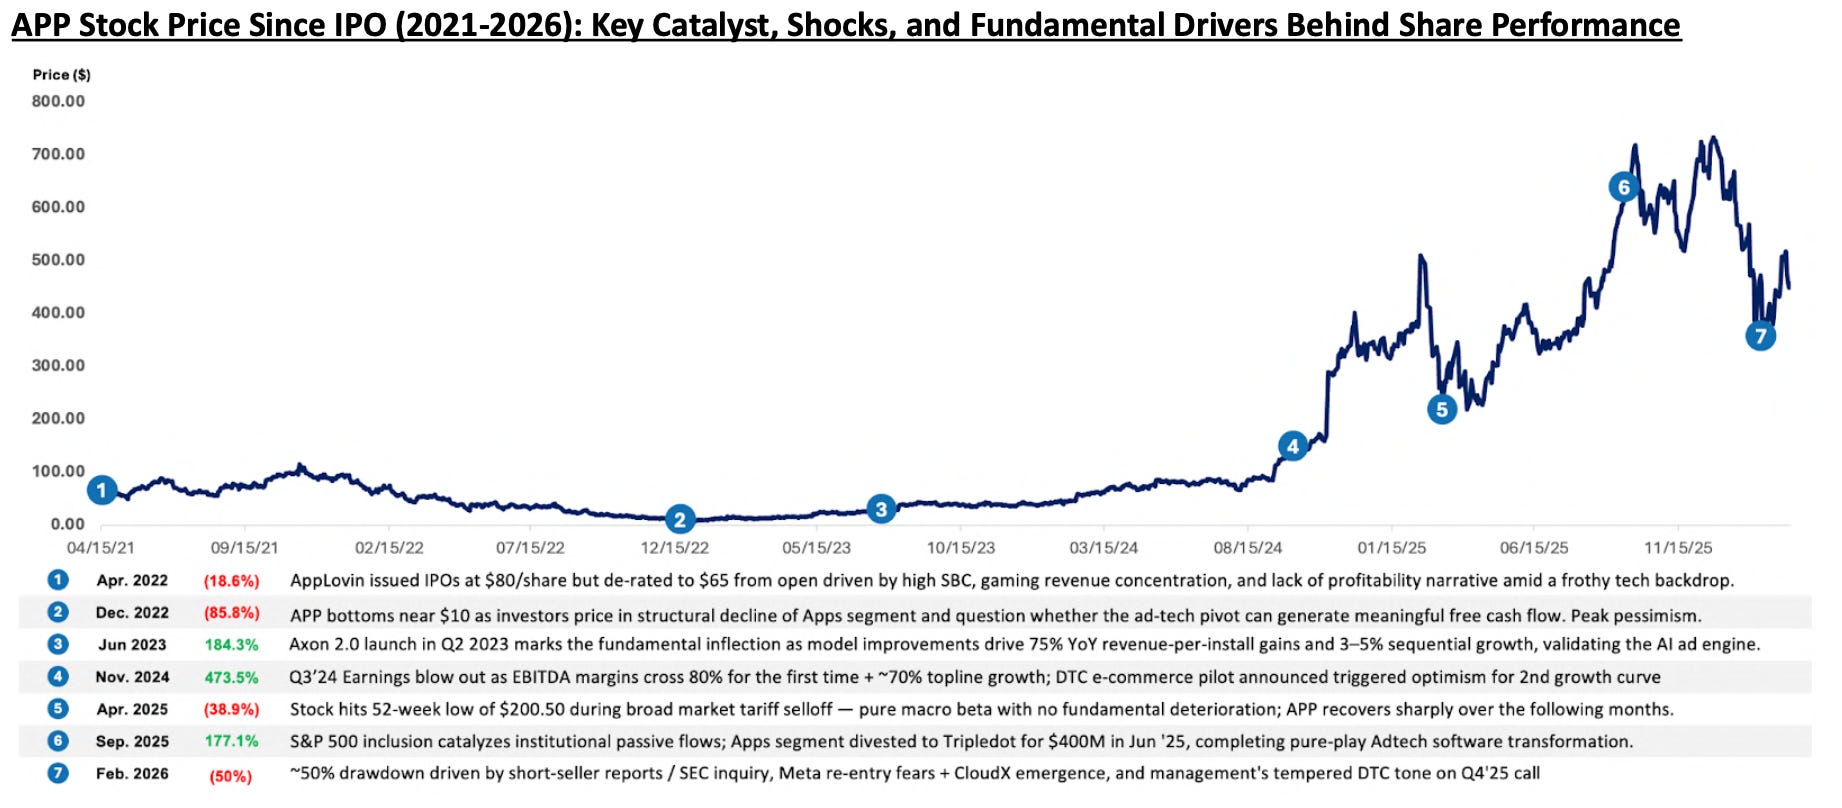
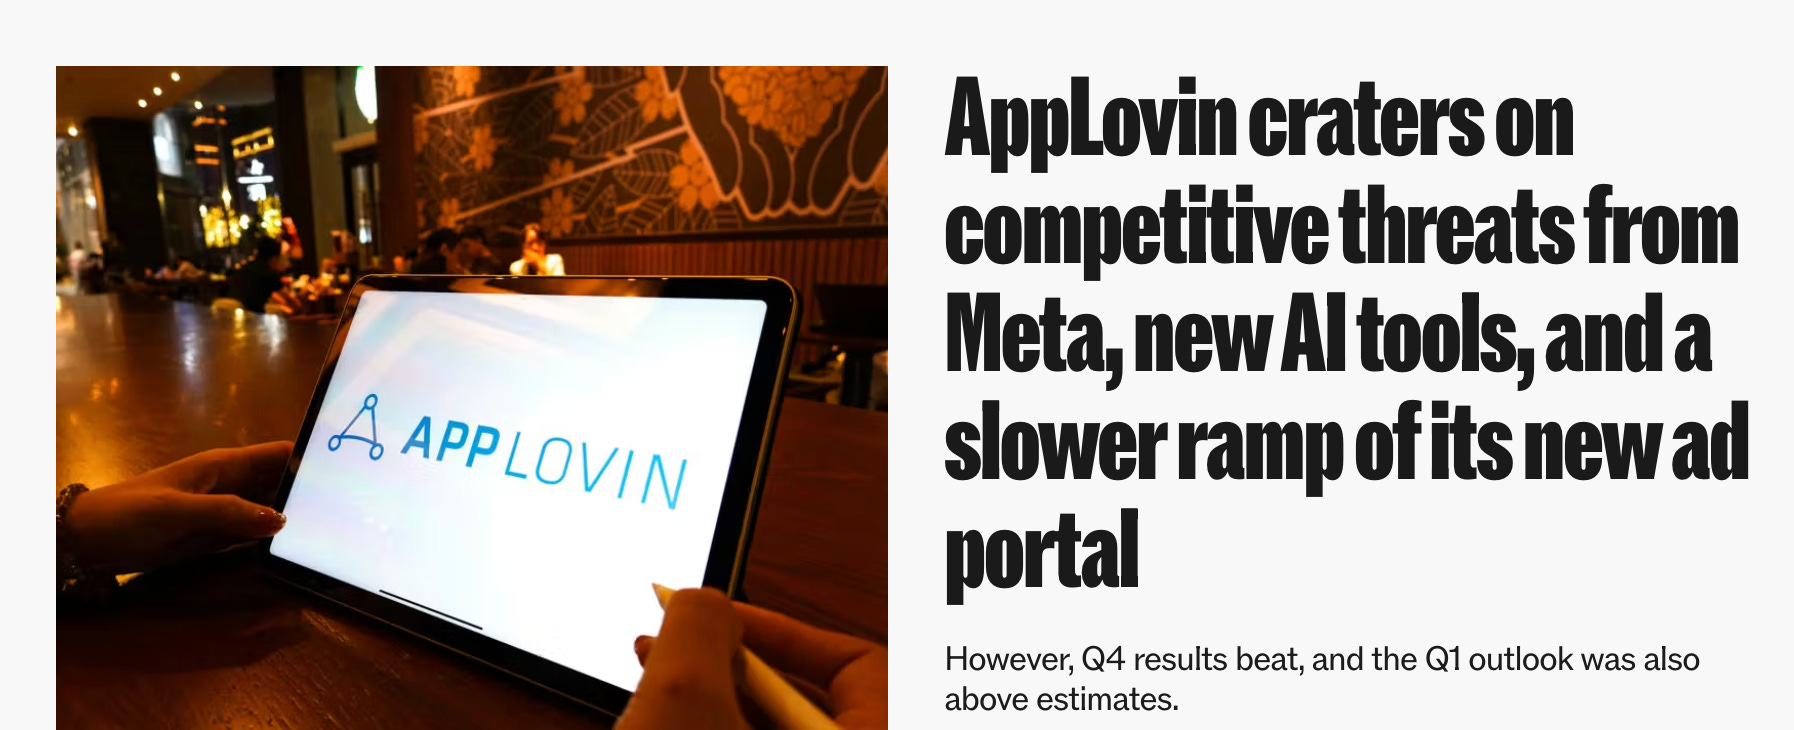
AppLovin (NASDAQ: APP) is the leading software infrastructure platform in in-app advertising. The company reached an ATH of $745 in December 2025 as investors underwrote both the durability of the core gaming business and the optionality around a new e-commerce vertical. It has since fallen 40% following Q4 earnings, despite what was arguably the strongest operating quarter in company history. The sell-off reflected concern that Meta’s return to in-app bidding could pressure AppLovin’s share of wallet and management’s conservative commentary on e-commerce signaled a slower revenue ramp than market had hoped.
Bulls see Axon’s closed-loop flywheel and MAX’s mediation dominance as winner-take-most dynamics that can sustain 30%+ CAGR as e-commerce expands the TAM 5–8x.
Bears argue gaming is structurally decelerating and DTC adoption will stall as weak creative infrastructure exposes the limits of Axon’s out-of-app targeting.
I disagree with bears and will be involved on the Long side: 1) competitive risk is structurally overstated because APP controls both sides of the mobile ad stack, making incremental Meta bidding activity on the demand side more accretive than zero-sum; MAX sits at the center of every auction and Axon observes the full competitive landscape in real time (which bids win, which lose, at what price, against which inventory) which generates a material data advantage over other DSPs;
2) Street expectations materially underwrite DTC, with consensus implying decelerating growth from 46% / 29% / 21% in 2026–2028 that implies minimal e-commerce contribution, whereas our bottoms-up work supports a $3.0–3.2B DTC revenue opportunity by 2028, with each incremental $1B of revenue adding ~$850M of EBITDA and ~$50/share of equity value; 3) APP’s full-screen, 30-second, unskippable video and interactive ad format is structurally superior to scaled alternatives, driving roughly 3.5x higher engagement with 95%+ completion rates.
The near-term catalyst setup is compelling with the Axon Ads Manager GA launch in 1H26, the GenAI video ad suite, and Q1’26 earnings on Wednesday May 6 all serving as potential re-rating events over the next 90 days.
Risk/Reward Set-Up
Revisiting share performance, APP’s YTD drawdown was primarily driven by distinct bear narratives, which included 1) Short-seller reports throughout late 2025 and early 2026 raised questions about AppLovin’s data collection practices, leading to an SEC inquiry and creating an overhang of uncertainty 2) Increasing competitive concerns as Meta’s re-entry into mobile in-app bidding and the emergence of CloudX as a mediation startup 3) disappointment around management’s tone on the near-term pace of the e-commerce opportunity, which undercut expectations for an immediate second growth curve.
At $460, the market is pricing APP at 23.1x FY1 EV/EBITDA and ~25.1x FY1 EV/EBIT (based on consensus FY26 EBITDA of $6,772M and EBIT of $6,240M from our comp data).
Consensus revenue estimates imply a YoY growth deceleration from 46% / 29% / 21% in 2026–2028 respectively. The market is pricing APP to grow ad revenue at approximately the same rate as historical mobile ad market growth (mid-20s CAGR) with no credit for (a) above-market growth from Axon model improvements, (b) any material DTC contribution, or (c) margin expansion from operating leverage on a pure software platform.
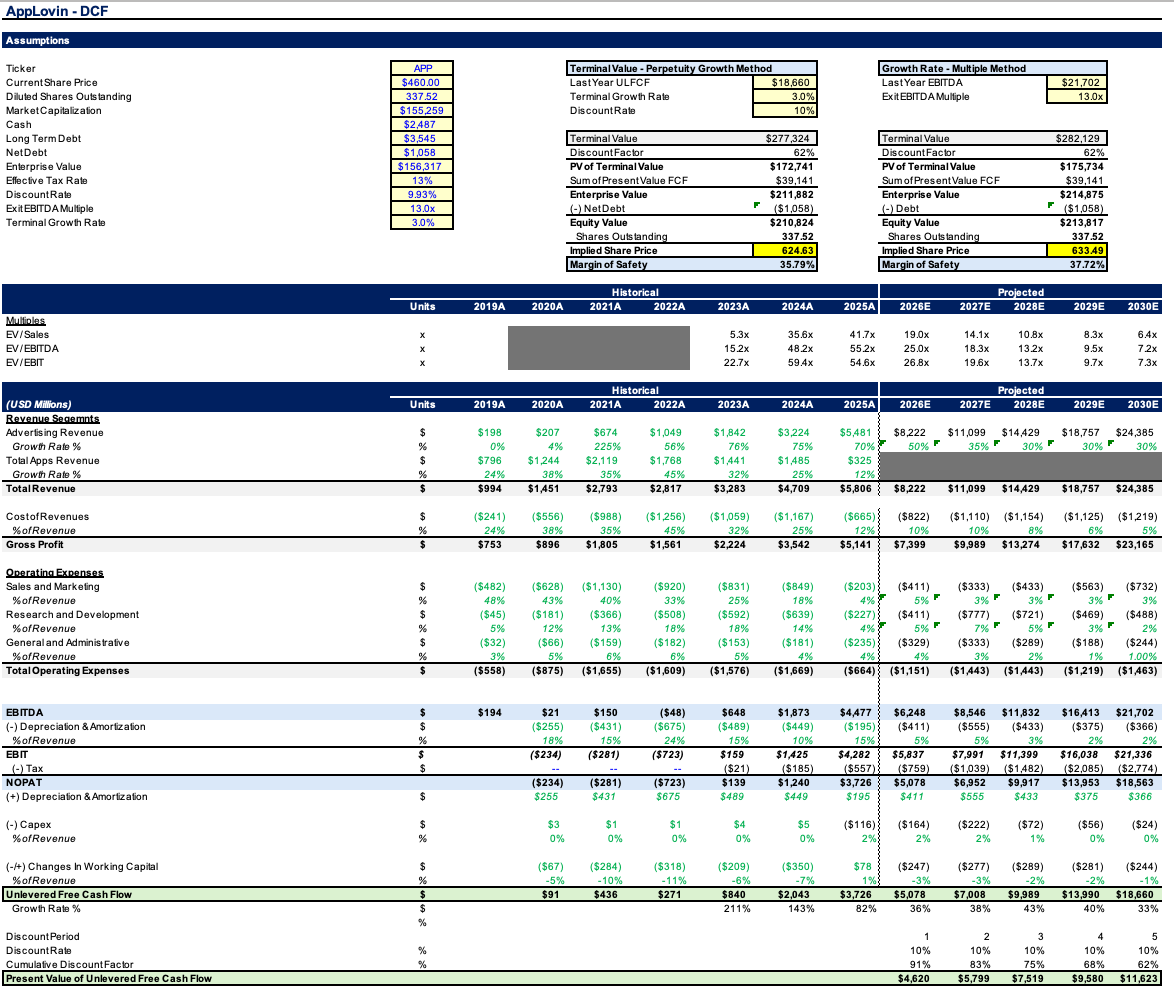
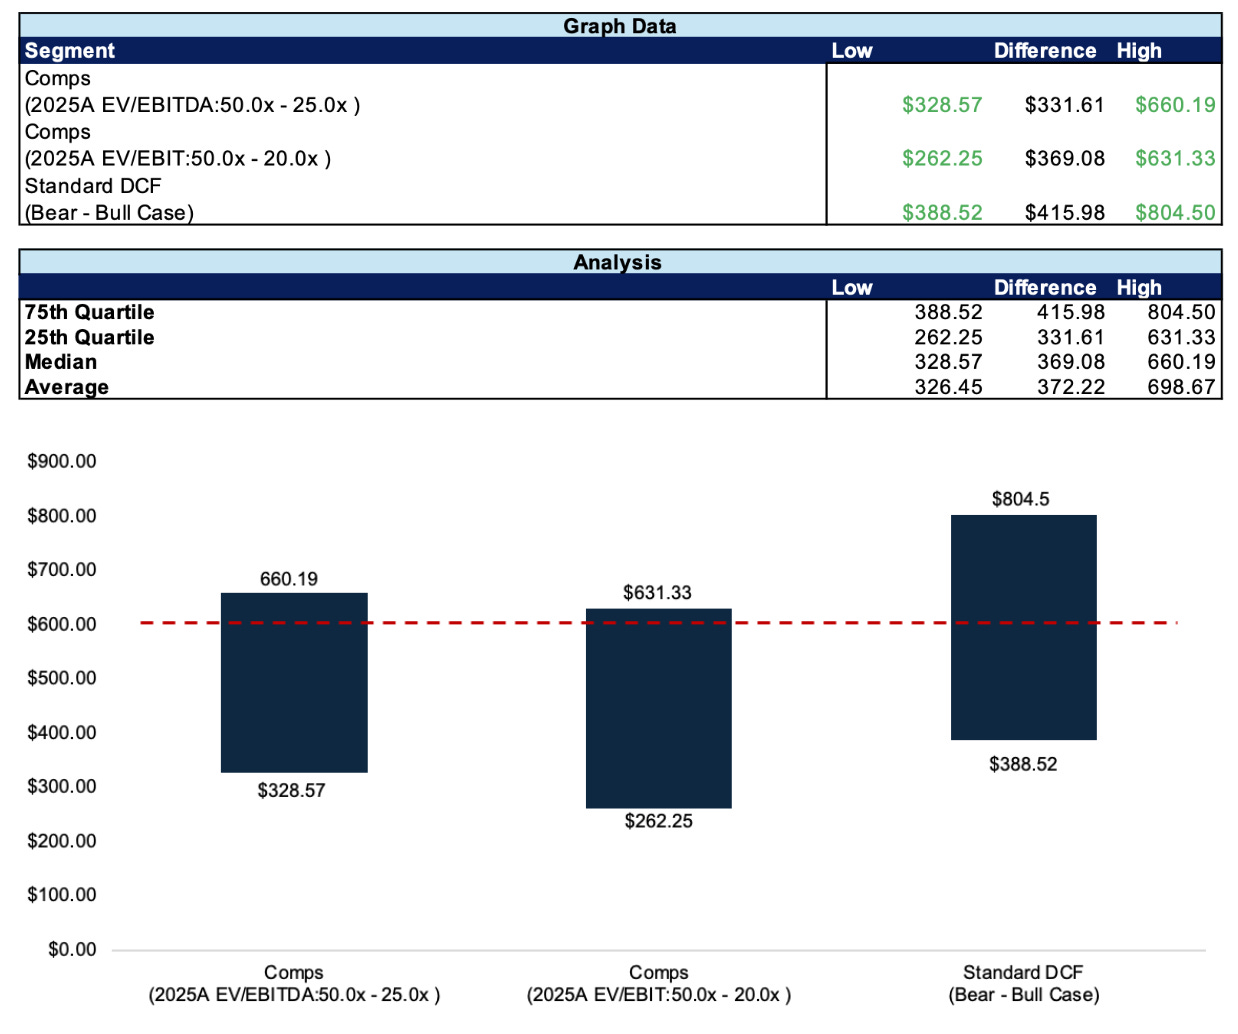
I anchor downside at ~$388.52/share, which reflects 17–20x trough EV/EBIT for a bear case scenario which underwrites the company at a multiple broadly consistent with median low-growth SaaS peers in periods of stable topline growth and multiple compression. Against that downside framework, my DCF yields an implied share price of $624.63–$633.49/share depending on terminal methodology, implying roughly 36% upside and an ~2:1 upside/downside skew. The model assumes ~33.2% revenue CAGR through 2030, driven by 25-30% growth in core gaming plus incremental contribution from DTC/e-commerce expansion, with ~85% incremental EBITDA flow-through and a 9.93% WACC (based on a 1.28 levered beta, 4.1% risk-free rate, and 5.5% ERP).
Company Overview
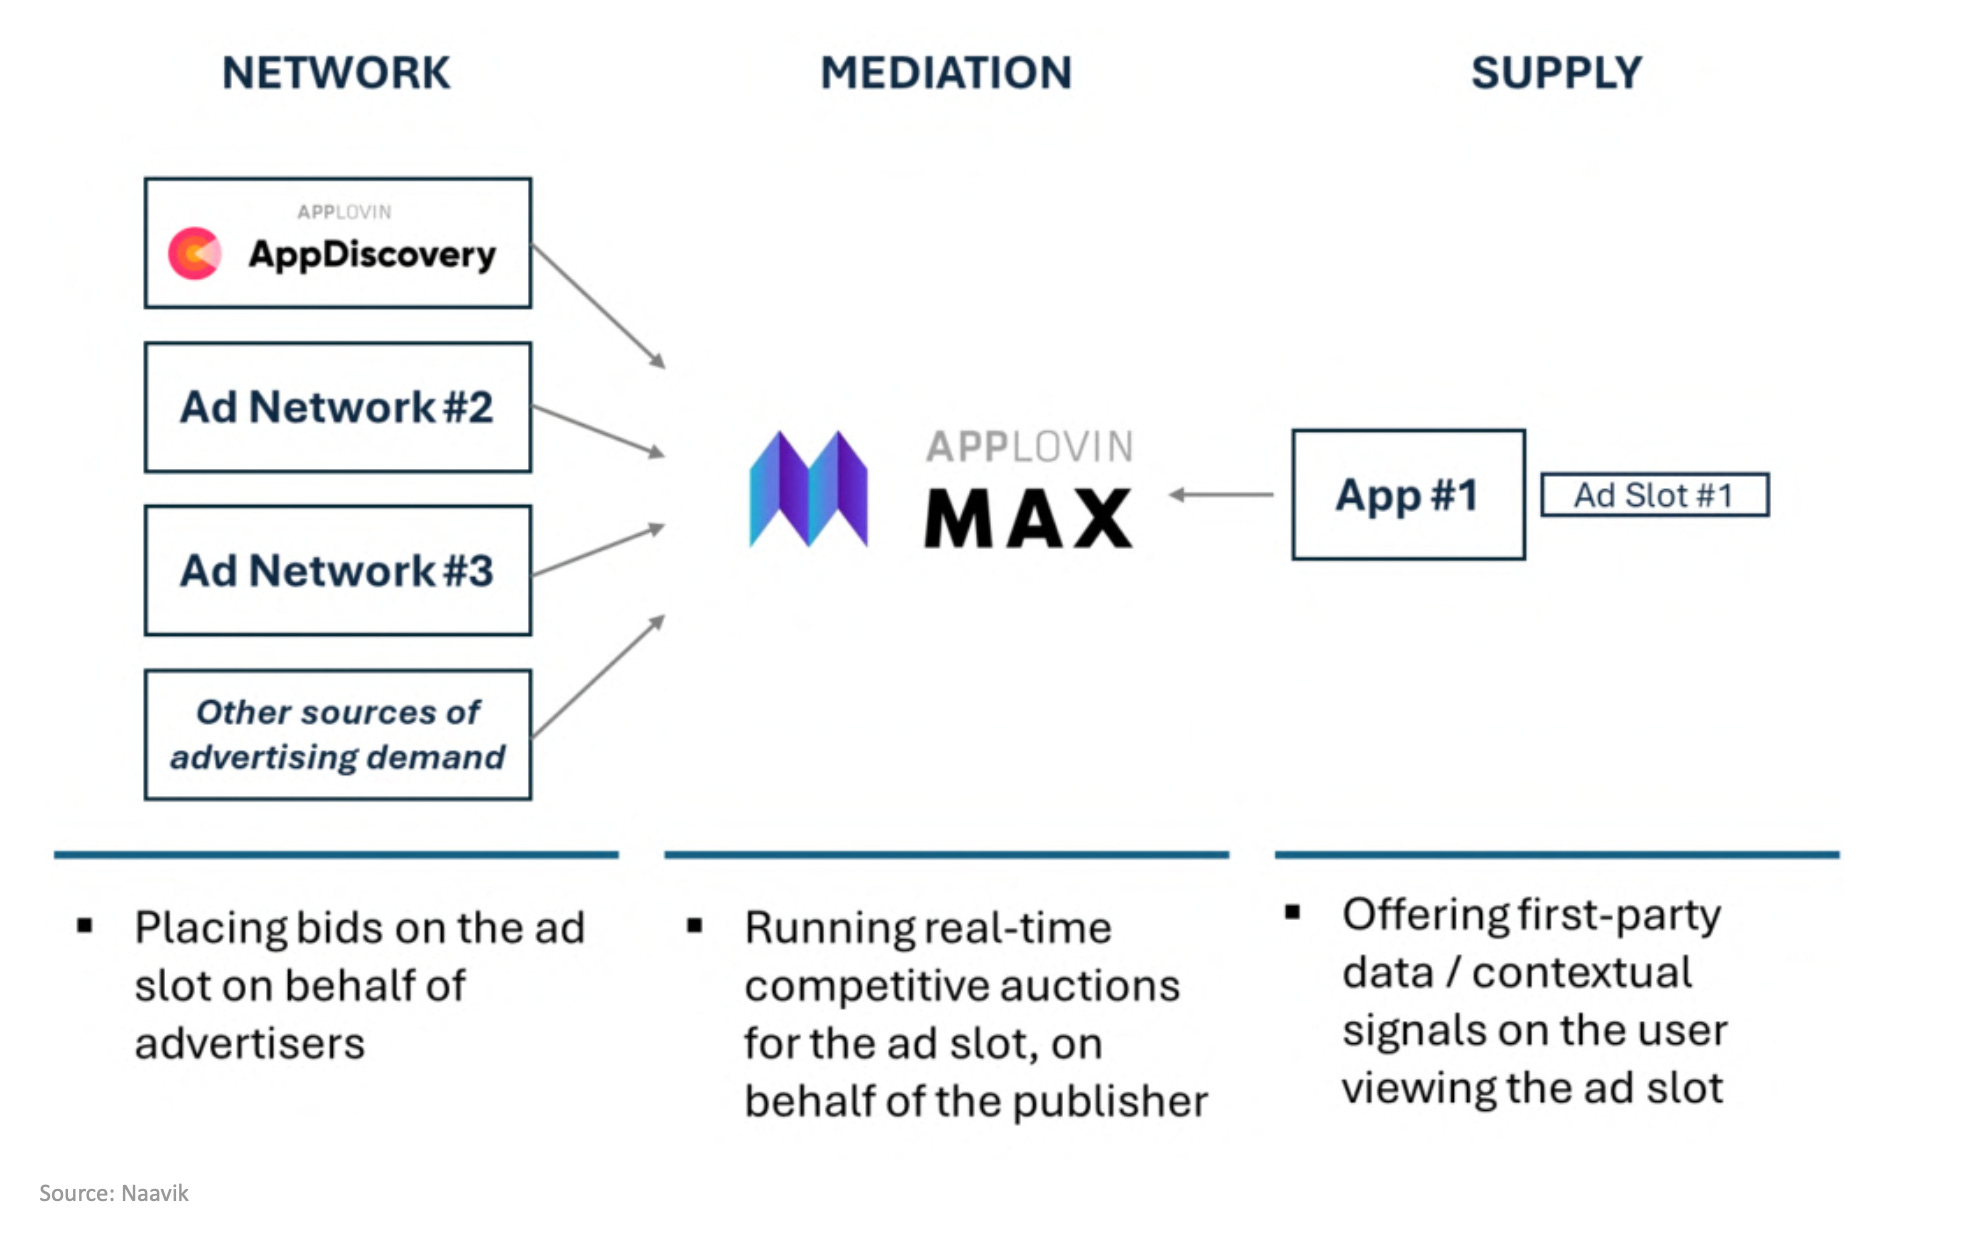
AppLovin operates a two-sided marketplace model in which it simultaneously acts as auctioneer and participant. The company controls the supply side of the ecosystem through MAX, the dominant in-app mediation platform that runs real-time auctions and processes roughly 2 million auctions per second across mobile gaming inventory. MAX is offered “free” to publishers but charges a 5% facilitation fee to third-party demand sources that bid through the platform.
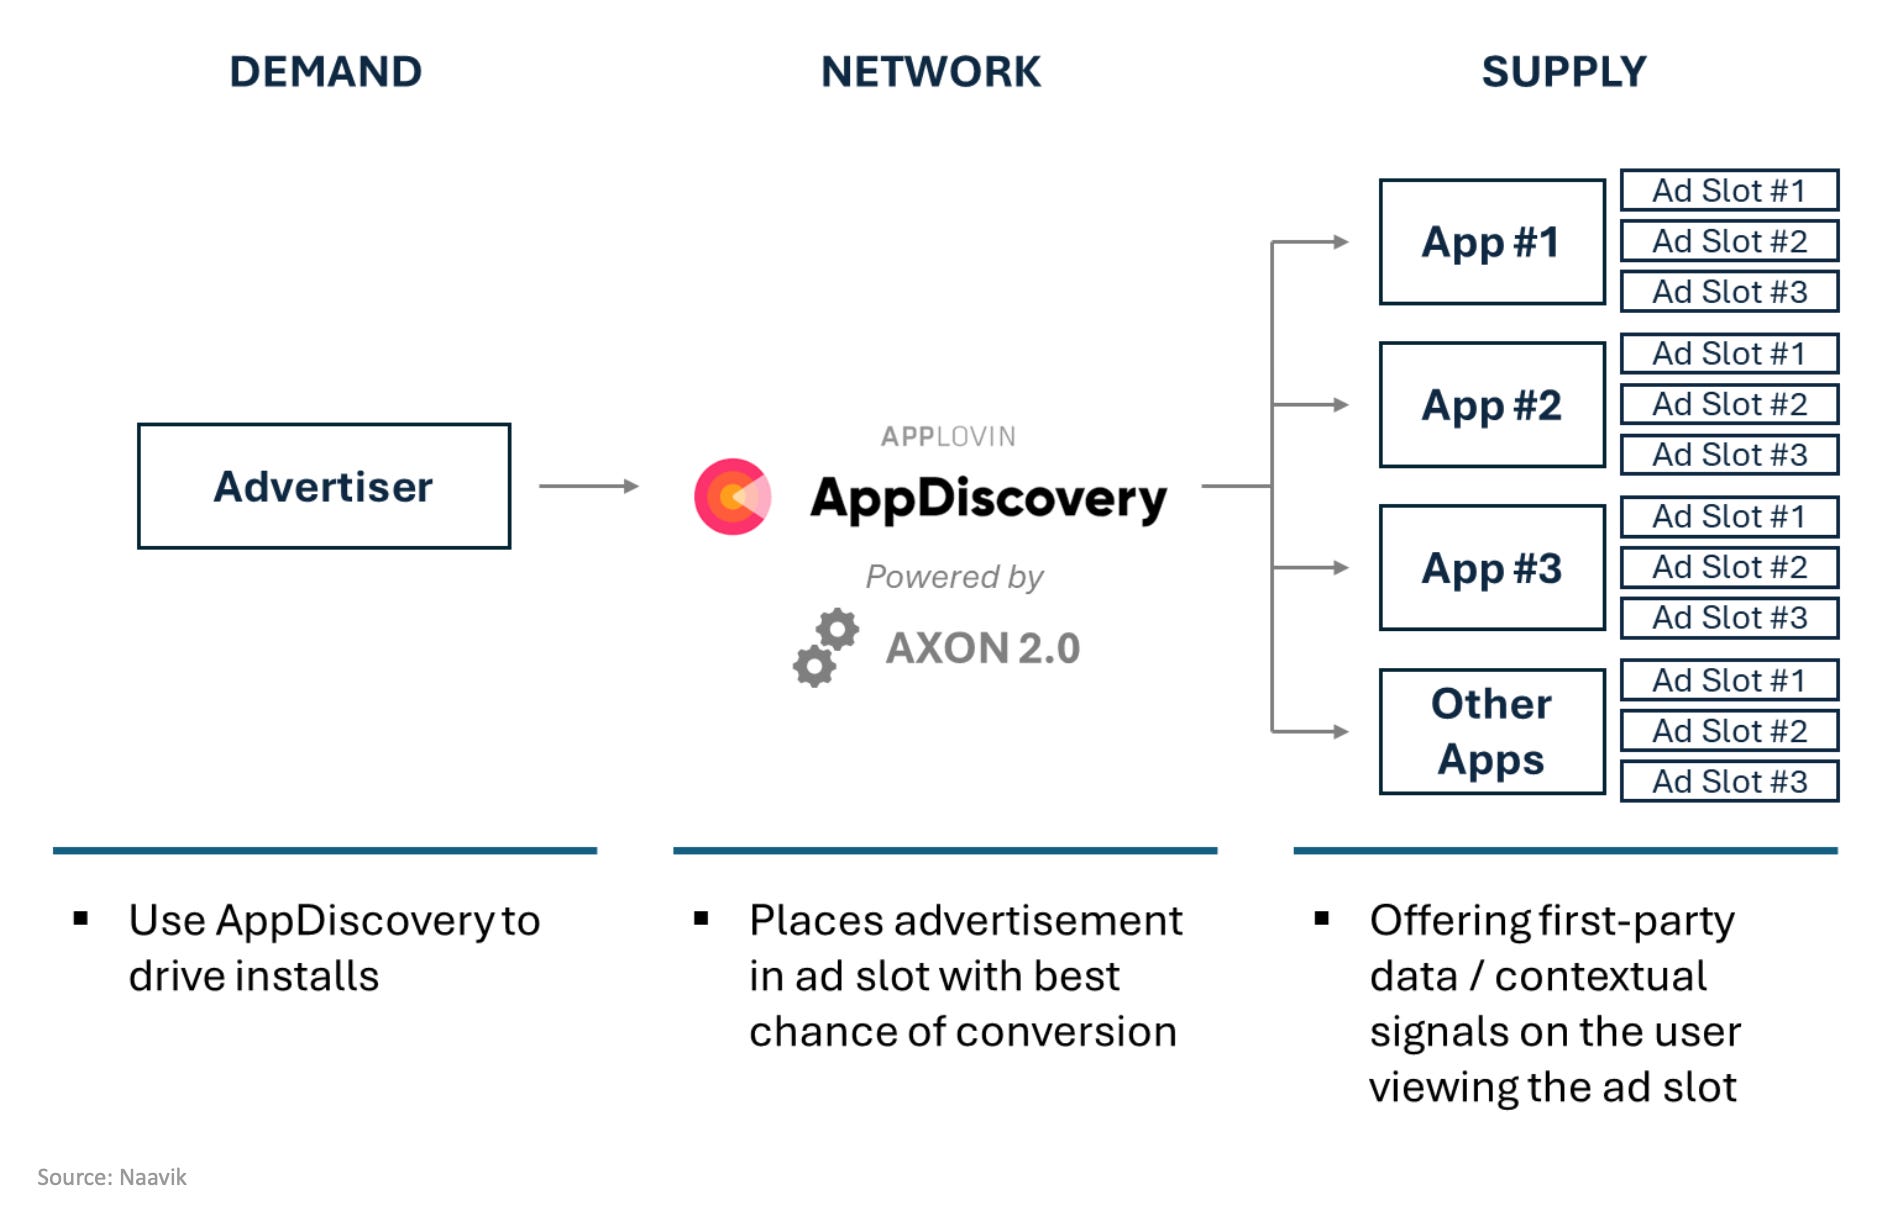
On the demand side, Axon 2.0 is a proprietary AI bidding engine that competes in those same MAX auctions to acquire users or serve performance ads on behalf of advertisers. AppLovin charges advertisers primarily on a cost-per-install (CPI) basis for gaming and increasingly on a CPA/ROAS basis for e-commerce. The company’s reported revenue represents the “spread” between what advertisers pay and what publishers receive. In gaming, where APP controls both demand (Axon) and supply (MAX), it retains approximately 45–50% of gross ad spend.
Today, advertisers spend more than $11 billion annually on the company’s platform, more than ad budgets of Snap, Pinterest, Twitter, and Reddit combined.
Business Quality and Growth
FY25 adjusted EBITDA margins of 82% and Q4’25 margins of 84% place APP in the top decile of all publicly traded software companies globally. The marginal cost of serving an additional auction or processing an additional ad impression is effectively 0 as the entire cost structure sits in 1) model training infrastructure, 2) a small engineering team and 3) data center compute.
Revenue quality is high yet susceptible. Advertiser spending on the platform is largely performance-based (Cost Per Install /Acqusition / Converson), meaning it is tied to measurable ROAS and is therefore relatively recession-resistant compared to brand advertising. Retention is structural as publishers remain on MAX because switching mediation platforms would cause immediate revenue decay (APP controls >50% of user acquisition spend for many publishers). This creates a form of economic lock-in that is arguably more durable than typical SaaS switching costs because it is rooted in real-time algorithmic performance rather than mere workflow habit.
Porter’s Five Forces
1. Competitive Rivalry (Moderate-High)
The mobile ad-tech ecosystem includes formidable players (ex. Meta Audience Network, Google AdMob, Unity LevelPlay (ironSource), TikTok/Pangle, and emerging players like Moloco and Liftoff.) However, AppLovin’s dual-sided market position (owning both supply and demand) means competitive entry on one side of the stack tends to be accretive rather than zero-sum. When bid density increases through Meta or others, total auction value rises and publishers earn more, which they reinvest into user acquisition on APP’s platform.
2. Bargaining Power of Suppliers (Moderate)
Suppliers are primarily mobile game publishers who provide inventory. While publishers could theoretically switch mediation platforms, doing so would forfeit the Axon-driven user acquisition spend that represents >50% of their marketing budgets. Apple and Google retain platform-level power through App Store policies, privacy frameworks (IDFA, Privacy Sandbox), and measurement rules—but APP has historically navigated these transitions better than peers (Axon 2.0 was specifically designed for the post-IDFA environment).
3. Bargaining Power of Buyers (Moderate)
Advertisers (gaming studios, DTC brands) have alternatives (Meta, Google, TikTok), but in this performance driven market, advertisers naturally optimize toward the highest-ROAS channel, and as long as Axon maintains its performance edge, switching costs are effectively the ROAS delta.
4. Threat of New Entrants (Low):
The barriers to replication are extraordinarily high. Building a competitive mediation layer requires signing hundreds of thousands of publisher apps and MAX is integrated into over 100,000 apps. Building a competitive AI bidding engine requires years of proprietary auction-level training data (Axon sees everyone’s bids and outcomes, while pure demand-side players see only their own). CloudX, the most-cited mediation startup threat, lacks the demand-side performance tools that create MAX’s real lock-in.
5. Threat of Substitutes (Moderate)
Privacy-driven platform changes (iOS ATT, Android Privacy Sandbox) could shift the landscape toward contextual advertising or first-party data models that favor walled-garden platforms (Meta, Google). CTV and retail media networks represent adjacent substitutes that could compete for marginal ad dollars. However, I view APP’s in-app gaming format (i.e. 30-second unskippable full-screen video with 95%+ completion rates) as a unique value preposition within all ad inventories with no direct substitute in terms of attention quality and measurability.
Management and Capital Allocation
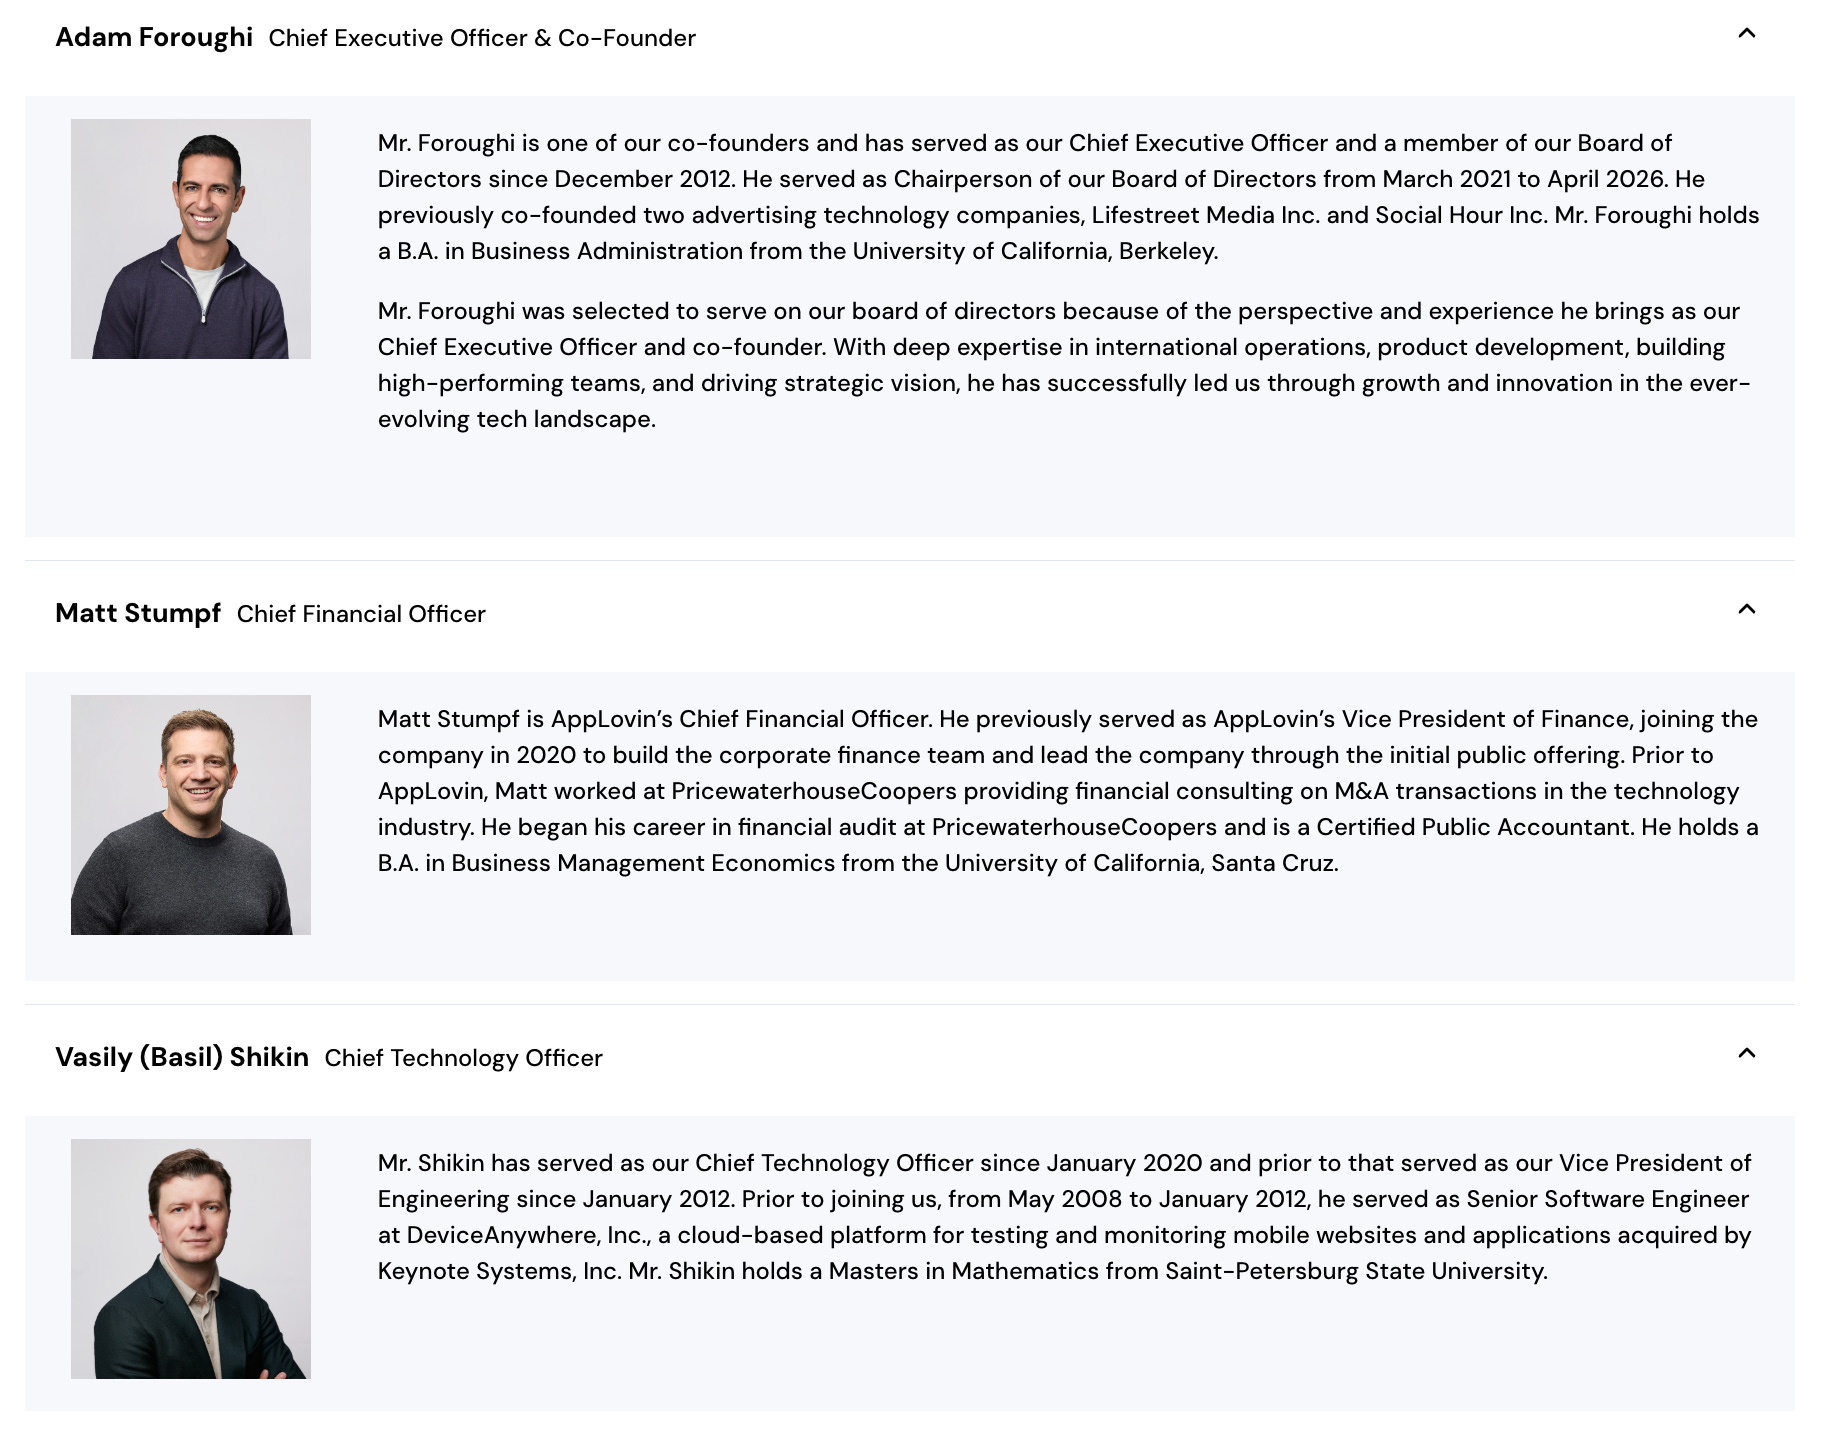
Adam Foroughi, co-founder and CEO since 2011 (14+ year tenure), owns approximately 10.9% of the company’s shares. Total insider ownership stands at 31% ($29B), providing exceptional alignment. Foroughi’s 2025 total compensation was $13M, of which 96.4% was stock-based which aligns management incentives squarely with equity holders. The lean organizational structure ( apporx. 900 employees with 400 core engineers ) reflects Foroughi’s well-documented bias toward operational efficiency and aversion to bureaucratic bloat.
Capital allocation has been disciplined and shareholder-friendly. Management has committed to returning 50–75% of annual free operating cash flow through share repurchases. The board authorized an incremental $500M for buybacks (irrespective of prior FCF-linked limitations), supplementing ongoing quarterly buyback capacity of ~$1.3B from quarterly FCF. At current prices, this implies 6–8% annual float reduction.
Debt management is conservative: $3.5B of long-term debt against $2.5B of cash yields net debt of ~$1.0B, or <0.25x net leverage on FY25 EBITDA. The debt is staggered across four tranches (2029/2031/2034/2054 maturities) with no near-term refinancing risk. S&P projects net leverage will remain under 1.0x over the next two years even without debt reduction.
Earnings Quality
First, stock-based compensation (SBC) was approximately $175M in FY25 (at roughly 3.2% of revenue), which is meaningfully below the software sector median of 8–12%. This means the gap between GAAP and non-GAAP earnings is smaller than at most high-growth software companies, and the dilutive impact of SBC is modest. Second, adjusted EBITDA is the company’s primary non-GAAP metric; the primary adjustments are SBC and amortization of acquired intangibles. There are no aggressive revenue recognition practices or unusual add-backs.
A potential concern is that APP recognizes revenue on a net basis (the spread between gross advertiser spend and publisher payouts), which means reported revenue understates the total economic activity flowing through the platform by roughly 2–2.5x. Investors should be aware that a $5.5B revenue figure corresponds to roughly $11B+ in gross platform spend.
Framing Key Debates / What’s On Investor’s Mind?
First, is the gaming ad business a 20% grower or a 30%+ grower? The bear camp points to the mathematical difficulty of sustaining 30%+ growth on a $5.5B base and argues that the mobile gaming ad market is growing mid-teens at best, meaning APP must continue taking share indefinitely. The bull camp points to Axon’s model improvement cycle (3–5% sequential growth from AI alone) and argues that APP is not a market-rate grower but a share-gainer with a compounding data advantage that has no historical precedent for mean-reversion.
Second, is DTC real? The bear camp argues that APP’s gaming inventory is demographically skewed (casual gamers, older demographics) and that sophisticated DTC brands will not scale budgets on a channel with limited creative tooling and no social graph. The bull camp points to $1B+ run-rate e-commerce ad spend already on the platform, Shopify integration with one-click catalog sync, and the GenAI creative suite that will close the creative gap—and notes that early cohort data shows ~$90 AOVs and ~30-day LTV:CAC breakeven, competitive with Meta/Google.
Where My View Diverges From Consensus
Our internal estimates differ from consensus in three specific ways:
First, I model higher total revenue: $8.2B in FY26 vs. consensus $8.1B, $11.1B in FY27 vs. consensus $10.5B, and $14.4B in FY28 vs. consensus estimates that imply continued deceleration. The gap widens in outyears because our model explicitly layers DTC revenue ($0.6–0.7B in CY26, $1.7B in CY27, $3.0–3.2B in CY28) on top of core gaming growth, while consensus appears to embed DTC implicitly at a much lower run-rate.
Second, I believe the market is mispricing the operating leverage inherent in a pure advertising software platform. Post-Apps divestiture, APP’s incremental EBITDA margins should approach 85–90% on software revenue. Our model shows EBITDA expanding from $6.2B in FY26 to $21.7B in FY30, a 3.5x expansion on 3.0x revenue growth, reflecting the natural leverage of a platform with ~900 employees and near-zero marginal cost of serving.
Third, and most importantly, the market is pricing zero optionality for the impression monetization rate inflection. APP currently monetizes 1.3% of impressions. The path from 1.3% to even 3% would roughly double the effective revenue capacity of the existing publisher base without any new supply additions. Consensus models do not appear to incorporate this dynamic, which creates an asymmetric payoff structure: if DTC density reaches critical mass and monetization inflects, the upside is non-linear and not captured in any sell-side model I have reviewed.
The net result is that at $460, I see APP priced for a good outcome (25% CAGR, stable margins) but not for the base case outcome our work supports (33% CAGR with margin expansion and DTC optionality).
Thesis 1: Competitive Fears Are Overblown
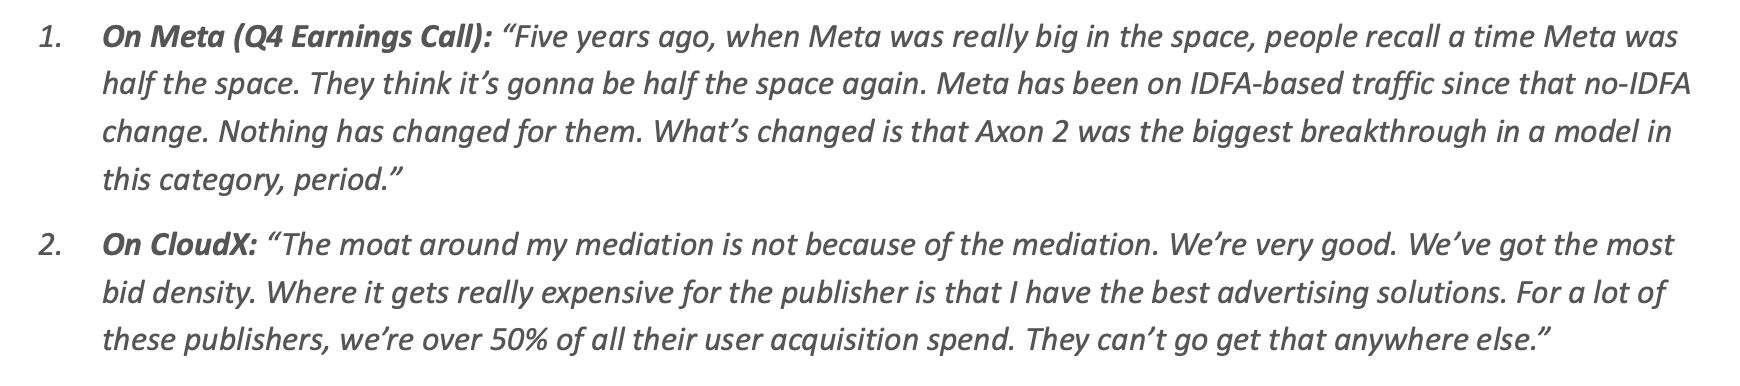
The market’s concern around share loss is predicated on the view that AppLovin is merely a demand-side ad network exposed to zero-sum competition from Meta or emerging platforms like CloudX. That framing misses the fact that AppLovin controls both ends of the mobile marketing stack.
APP’s strategic advantage is its control of the auction supply layer through MAX, positioning the company as a transaction intermediary rather than simply another bidder. In this framework, increased competition is potentially accretive. When bid density increases through the entry of additional demand sources (including Meta), the total value of the auction “pie” expands. When a competitor wins an impression that Axon valued less highly, the publisher earns more revenue, which they often reinvest back into user acquisition on AppLovin’s platform. The bear case on competition implicitly assumes that what AppLovin has built is an ad network, when what it has actually built is an information advantage. Because MAX sits at the center of every auction across the mobile gaming ecosystem, Axon observes the full competitive landscape in real time (i.e. which bids win, which lose, at what price, and against which inventory) across 2 million auctions / second. No pure demand-side player, including Meta Audience Network, has access to that signal. Meta sees only its own bids and its own wins; while Applovin’s Axon sees everyone’s. That data asymmetry compounds over time because every auction generates incremental training data that makes the model marginally smarter, which improves ROAS, which attracts more advertiser spend, which generates more auction data, and so on in a closed loop that widens with scale rather than mean-reverting.
Five years ago, when Meta dominated mobile gaming ad spend, Axon 2.0 did not exist. The breakthrough in model performance that AppLovin achieved fundamentally changed the share dynamics. Today, the company controls over 50% of user acquisition spend for many of its publishers, creating a structural moat where switching mediation would risk immediate revenue decay.
Furthermore, AppLovin charges an approximate 5% fee to outside winning bidders on low-value impressions, ensuring it monetizes the auction even when its own demand engine is not the primary winner. Every time a new competitor has scaled within the MAX ecosystem (i.e. Unity Vector, Liftoff Cortex, Moloco, Google switching to bidding) the same confusion has arisen about zero-sum dynamics, yet every time, APP’s economics have improved rather than deteriorated.
Another fear around Meta specifically centers on the possibility that Meta could leverage its massive internal “audience graph” (login data, social connections) to bid deterministically on opt-out IDFA traffic, creating an information advantage over AppLovin’s probabilistic Axon 2.0 model. On Meta, management believes fears of iOS re-entry are overstated and expects Meta’s iOS activity to be incremental competition but not disruptive to growth or margins. Meta Audience Network has been a longtime bidder within APP’s ad supply and that incremental bidding activity on IDFA traffic is not something new. Even on Android, where Meta fully competes today, APP remains the dominant player in mobile mediation. Regarding CloudX’s entry into mediation space, APP’s scale, data advantage, AI model strength, advertiser relationships, and superior buying tools (including ROAS and blended ROAS models) ensure that CloudX or any other mediation startup does not pose a viable threat.
While investors are increasingly focused on the e-commerce opportunity, the core gaming business remains healthy and is still expected to grow meaningfully. Gaming continues to serve as an important monetization engine and foundational earnings driver for the broader platform. Management also noted that repeated model releases have allowed APP to grow above underlying industry growth rates, and they continue to believe model improvements can drive roughly 3% to 5% sequential quarter growth in gaming solely. The technology is still in its early stages and directed model enhancements + recursive learning from data will continue to compound.
Investment Thesis 2: DTC / E-Commerce Is a Quantifiable Greenfield Opportunity
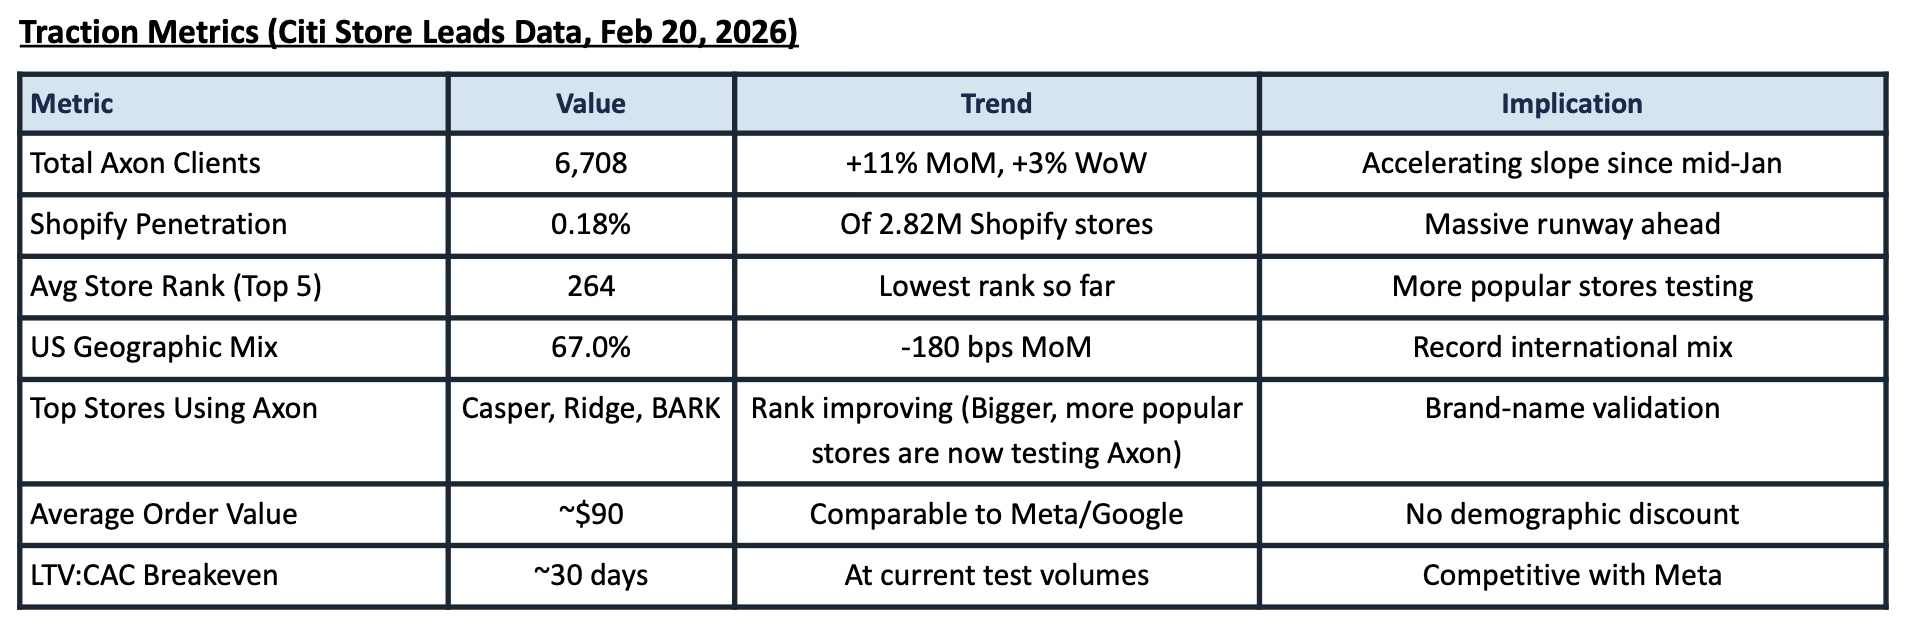
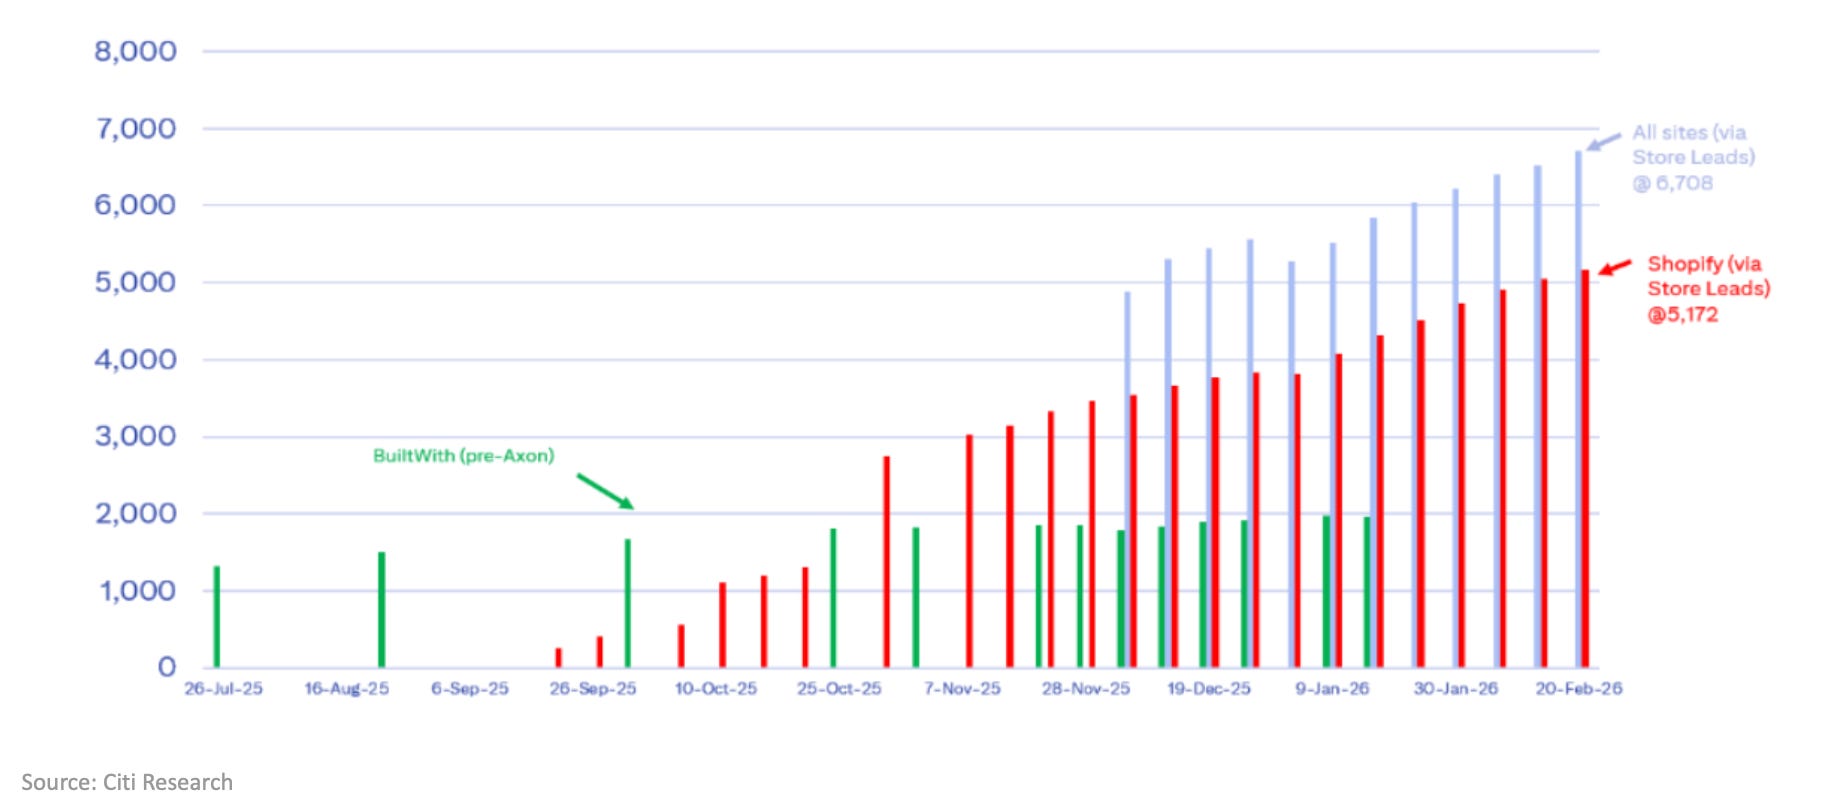
The e-commerce opportunity is simultaneously the most important and most misunderstood part of the AppLovin thesis, and it is critical to frame it correctly from the outset: this is a very nascent business. As of December 2024, AppLovin had approximately 600 e-commerce clients. Fourteen months later, that client count stands at 6,708, representing roughly 11x growth, and the platform remains referral-only with 0.18% penetration of Shopify’s 2.82 million stores.
Management has stated that e-commerce expands AppLovin’s TAM by approximately 5-8x relative to its core mobile gaming vertical. The global mobile advertising market was valued at approximately $262–$320 billion in 2025, with retail and e-commerce the fastest-growing segment. In-app advertising alone exceeded $350 billion in 2024 and is projected to reach over $530 billion by 2029. AppLovin enters as the fourth scaled performance channel behind Meta (~60–70% share), Google (~15–20%), and TikTok (~5–10%), with differentiated signals from in-app behavioral data and competitive unit economics.
Citi publishes weekly tracking data on Axon’s e-commerce adoption using Store Leads and BuiltWith, providing the most granular real-time view available to investors. Through February 20, 2026, Store Leads suggests AppLovin has 6,708 eCommerce clients, up 3% from the prior week. Approximately 77% of Axon firms (5,172 clients) also use Shopify. Axon adoption among Shopify customers grew 15% MoM and 3% WoW. Critically, Axon adoption among all Shopify stores (2.82 million) remains at just 0.18% penetration, implying a massive runway. The average store rank among the five most popular Shopify stores using Axon reached 264, the lowest rank so far (note that lower rank implies that more popular stores are now testing Axon). Geographic diversity hit a record: 67.0% US, with international mix rising 180 basis points over the prior month. Apparel (24.7%) and Beauty & Fitness (19.3%) comprise approximately 44% of stores.
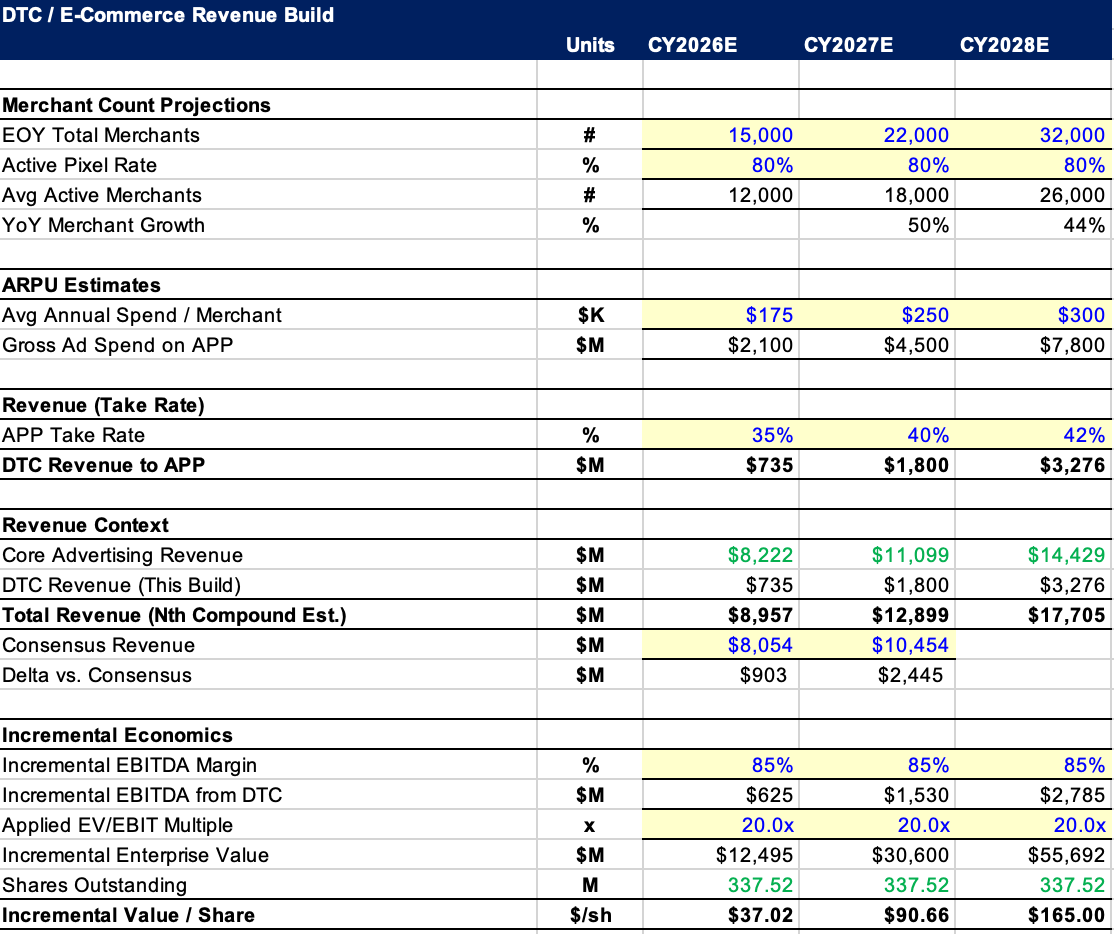
DTC Revenue Build → Merchant Count x ARPU x Take Rate
Merchant Count: My bottoms-up quantification anchors to known data points provided with Citi datapoints. At the current onboarding pace of approximately 200+ additions per week (accelerating), APP would end 2026 with roughly 15,000–16,000 total merchants. Applying the observed 80% active pixel rate yields 12,000–13,000 active advertisers by year-end. Note that these figures reflect a platform that remains referral-only with meaningful access constraints. Initial advertiser selection required at least $10 million in gross merchandise value, a threshold that has since loosened as the self-serve tool reduced GMV gating and brought in smaller merchants, but the platform still operates on a curated referral-and-waitlist basis. Without a valid referral code, prospective advertisers are placed on a waitlist pending AppLovin’s approval. Foroughi disclosed on the Q4 call that only 57% of qualified leads currently convert to active advertisers, citing lack of properly formatted full-screen creative as the primary inhibitor. My 15,000 merchant estimate therefore assumes the current gated regime persists for the full year and credits zero acceleration from the GA launch targeted for 1H 2026. If GA removes the referral gate in Q2 and drives even a modest acceleration to 300–400 weekly adds in 2H alongside improved conversion rates as GenAI creative tools lower the production barrier the merchant count could reach 20,000+, pushing CY26E DTC revenue toward $800M–$1B rather than my base estimate of $600–700M.
ARPU Estimates: Regarding average annual spend per DTC merchant, the early-stage minimum for the closed beta was $20K/day (~$7.3M/year), but the referral program has opened the funnel to smaller merchants. A reasonable blended average for 2026 is $150–200K per active merchant, reflecting a mix of scaled brands spending $1–5M+ and long-tail Shopify merchants testing at $50–100K. At the midpoint, gross advertiser spend on AppLovin’s e-commerce platform reaches roughly $1.8 - 2.0 billion in 2026.
Revenue (Take Rate): AppLovin’s reported revenue is the “spread” between what advertisers pay and what publishers receive for ad inventory. In gaming, AppLovin retains approximately 45–50% of gross ad spend because it controls both the demand side (Axon bidding) and the supply side (MAX mediation). In DTC/web advertising, AppLovin is demand-side only (there is no MAX equivalent for web traffic), so the initial take rate is likely lower (approximately 30–40%) and should converge toward gaming levels as performance proves out and pricing power increases. At a 35% blended take rate on $1.8 billion of gross spend, DTC contributes roughly $600–700 million in APP revenue for 2026. By 2028, my bottom-up build projects DTC revenue of $3.0–3.2 billion to topline, which matches a roughly 4-5% TAM penetration of the total gross Ad spend share of $80-100B/Year by 2028

Conversion Rate Upside From Expanding DTC Inventories
AppLovin currently monetizes only ~1.3% of the impressions it serves, meaning 98.7% of impressions generate no revenue. That reflects a supply-demand matching constraint rather than a model quality issue. The algorithm performs extremely well when it sees a true high-intent moment. Management has said conversion exceeds 5% when the platform identifies a user who is disengaging from their current game and is likely to churn.
The issue is that those moments are rare: most users are still satisfied with the game they are playing. Historically, AppLovin lacked enough advertiser diversity to monetize the rest of that inventory effectively. If the platform only has gaming ads to show, it ends up serving repetitive ads to users with limited purchase intent. That creates fatigue and leaves a large share of impressions under-monetized.
E-Commerce expands the advertiser base and gives the model far more options on each impression. As advertiser density grows across e-commerce and other DTC categories, the model will be able to serve a different, personalized product in every impression. The model will exclusively reserve gaming ads for those rare, high-value moments where the conversion rate is already >5%, ensuring game developers face no cannibalization and get maximum value. For all other impressions, instead of forcing a gaming ad, the system will seamlessly pivot to serving a highly personalized e-commerce or lead-generation product. Management fully expects conversion rates to exceed 5% as density builds.
A roughly 4x improvement in conversion rate would not translate linearly to 4x revenue because the majority of advertiser spend flows to publishers as payment for ad space, and AppLovin reports the spread as revenue. However, Foroughi argued the outcome could actually be better than 4x to the bottom line if the company’s technological lead allows it to capture an expanding spread in the auction. This implies that at scale, APP’s current $5.5B revenue base has a theoretical path to $20B+ just from improving the conversion rate on existing supply, before any new publisher additions.
Investment Thesis 3: Unmatched Ad Format Value Proposition and Technological Moat of the AXON + MAX Ecosystem
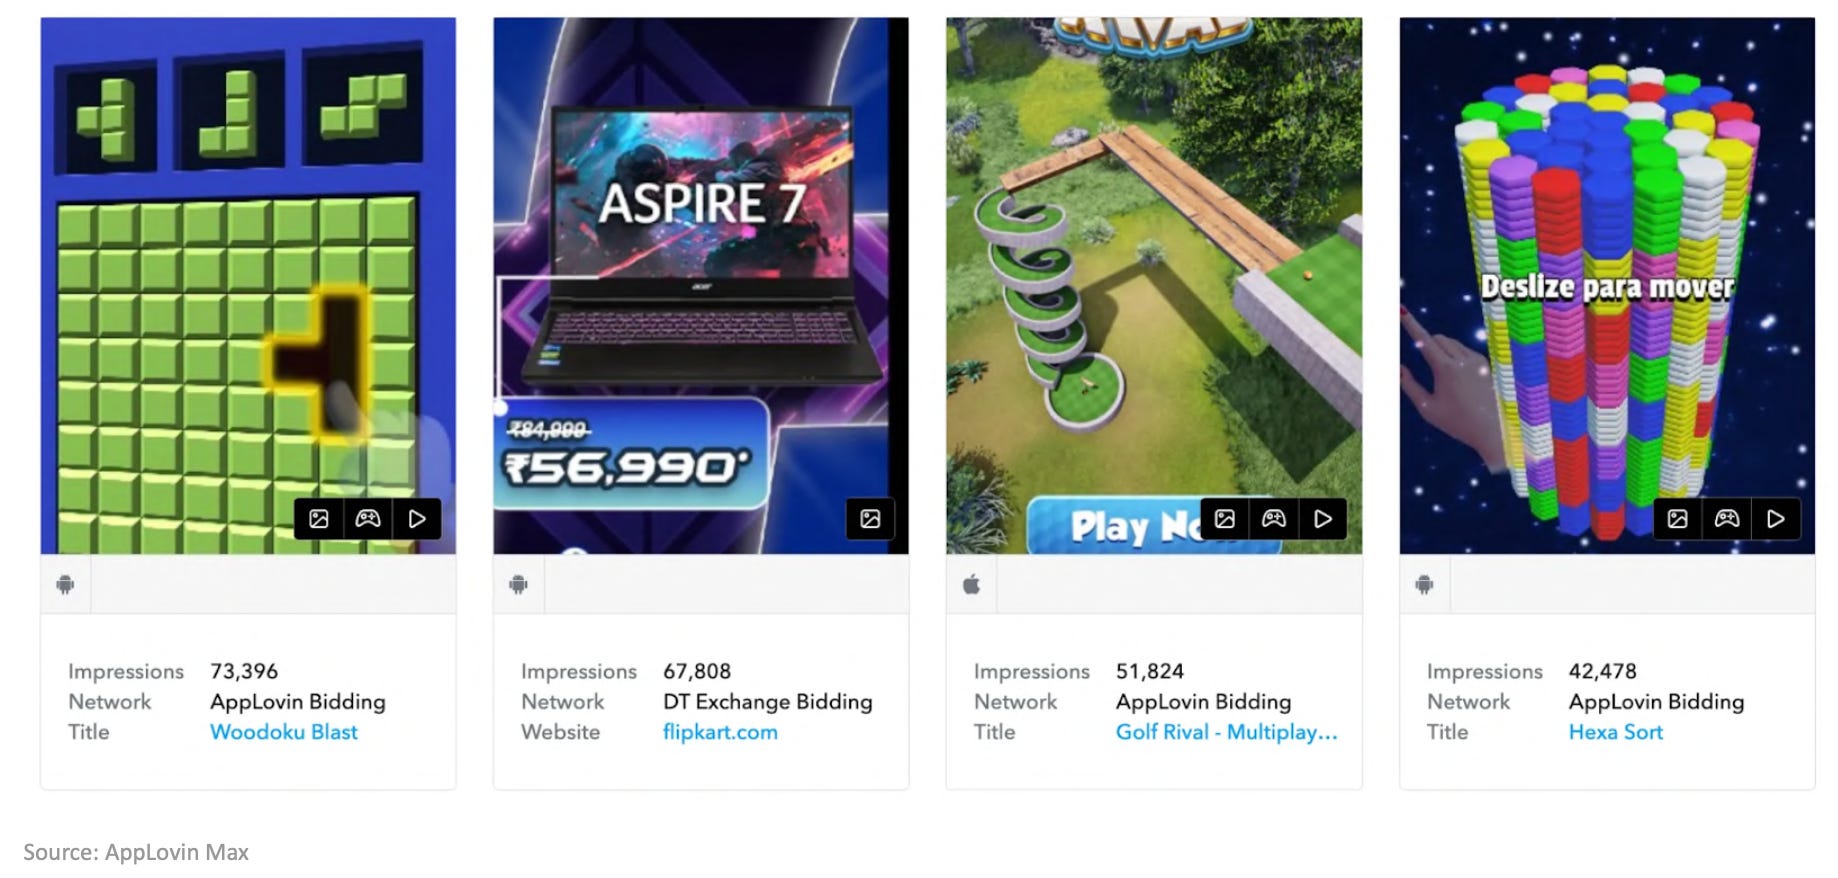
AppLovin’s advertising inventory is fundamentally different from every other scaled digital ad platform, and this difference is underappreciated by investors who compare AppLovin to Meta, Google, or TikTok without understanding the underlying ad format. Approximately 95% of AppLovin’s ad impressions are full-screen, unskippable video ads lasting >30 seconds, served during natural breaks in gameplay—between levels, after completing a puzzle, or as rewarded placements where users voluntarily opt in to watch in exchange for in-app rewards such as extra lives, virtual currency, or premium content. This creates a viewing environment with completion rates above 95%, compared to 60–70% for standard video formats on platforms where users can scroll past or skip after five seconds.

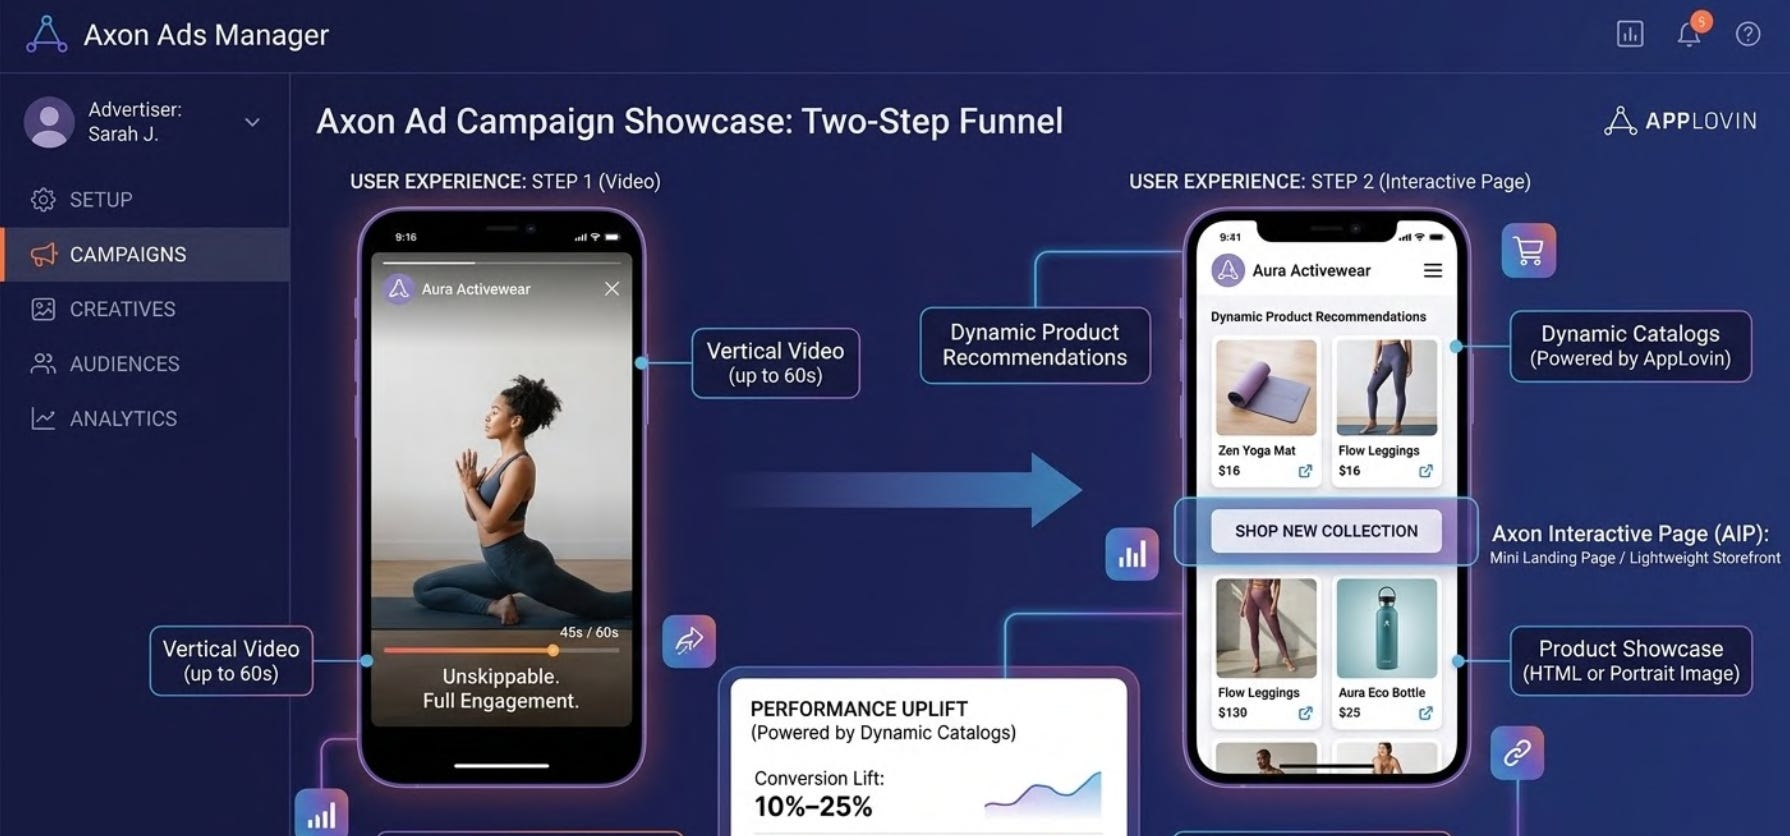
The unique Ad-format has been incremental for advertiser ROAS. What makes Axon’s ad format unique is that it operates as a three-step conversion funnel rather than a standard ad unit: (1) a full-screen 30-60s UNSKIPPABLE vertical video captures attention, (2) an Interactive Page deepens engagement through CTAs, branded content, and product merchandising, and (3) Dynamic Catalog integration personalizes the experience with relevant product recommendations that move the user toward purchase. In my view, that structure makes Axon meaningfully more valuable than a simple click-out format because it compresses awareness, consideration, and conversion into a single mobile-native ad flow. When a user voluntarily commits to watching a 30-second full-screen video with audio enabled, the advertiser captures undivided attention in a single-app environment—unlike a laptop browser where a user might have 30 tabs open, or a social media feed where users scroll past within one to two seconds. The result is engagement rates approximately 3.5x higher than traditional video formats and click-through rates that exceed comparable social media placements for many DTC brands.
This ad format advantage is compounded by Axon’s closed-loop reinforcement learning system, which represents a genuine technological moat. Axon processes five distinct data streams for every impression collected from 2 million ad auctions per second: 1) MAX loss notifications (standard auction data) 2) advertiser conversion data when shared, 3) gaming usage patterns from the broader network, 4) third-party data from mobile SDKs and web pixels, and 5) user engagement data from its own ad interactions.
Every time a user watches a rewarded video, Axon captures dozens of micro-interactions (i.e. how long the user engaged, where they tapped, whether they replayed sections, how quickly they responded to the call-to-action). Each interaction generates incremental conversion feedback, which improves model quality and targeting accuracy, which then attracts additional advertiser spend. As a result, the more ads AppLovin serves -> the smarter the model gets -> better ROAS -> the more advertisers spend -> incremental revenue opportunity for the company. Since Axon 2.0 launched in Q2 2023, Ad spend on the platform has increased 4x while revenue per installation has increased 72% YoY as total installations only improved by 3%, meaning the entirety of the platform’s revenue acceleration has come from model-driven monetization improvement rather than volume expansion. In a sell side callback, management confirmed that 1) approximately 70% YoY growth has been driven by backend model improvements instead of new product releases, and 2) model improvements alone can drive 3–5% sequential growth per quarter for the gaming business.

Industry analysis suggests Axon is already delivering meaningfully superior performance relative to incumbent mobile ad platforms, with roughly 45% higher ROAS than Meta Audience Network on comparable inventory, driven by Axon’s event-level behavioral optimization rather than social-graph-based targeting. On the DTC side, early William Blair cohort data indicates ~$90 average order values, broadly in line with Meta and Google, with ~60% of purchases occurring within one hour of engagement, suggesting strong user intent and no obvious demographic quality trade-off as Axon expands beyond gaming. Just as importantly, ~30-day LTV:CAC breakeven implies advertisers can scale spend on the platform with economically attractive payback periods.
Today, DTC advertisers remain at a structural disadvantage, with roughly 1,000 creatives per campaign versus 50,000+ for mobile game developers, limiting model performance and slowing optimization. AppLovin is now addressing that bottleneck through its GenAI stack, including multi-agent tools for interactive landing pages, early traction in static image generation, and expected AI video capabilities that should enable higher-volume, higher-performing 15–30 second ads tied to dynamic product catalogs. As that toolset matures, the combination of unskippable full-screen inventory, gaming-like creative scale, and Axon’s closed-loop optimization engine could create a performance marketing channel with a level of efficiency and feedback density that is difficult for peers to replicate.
Catalyst Path
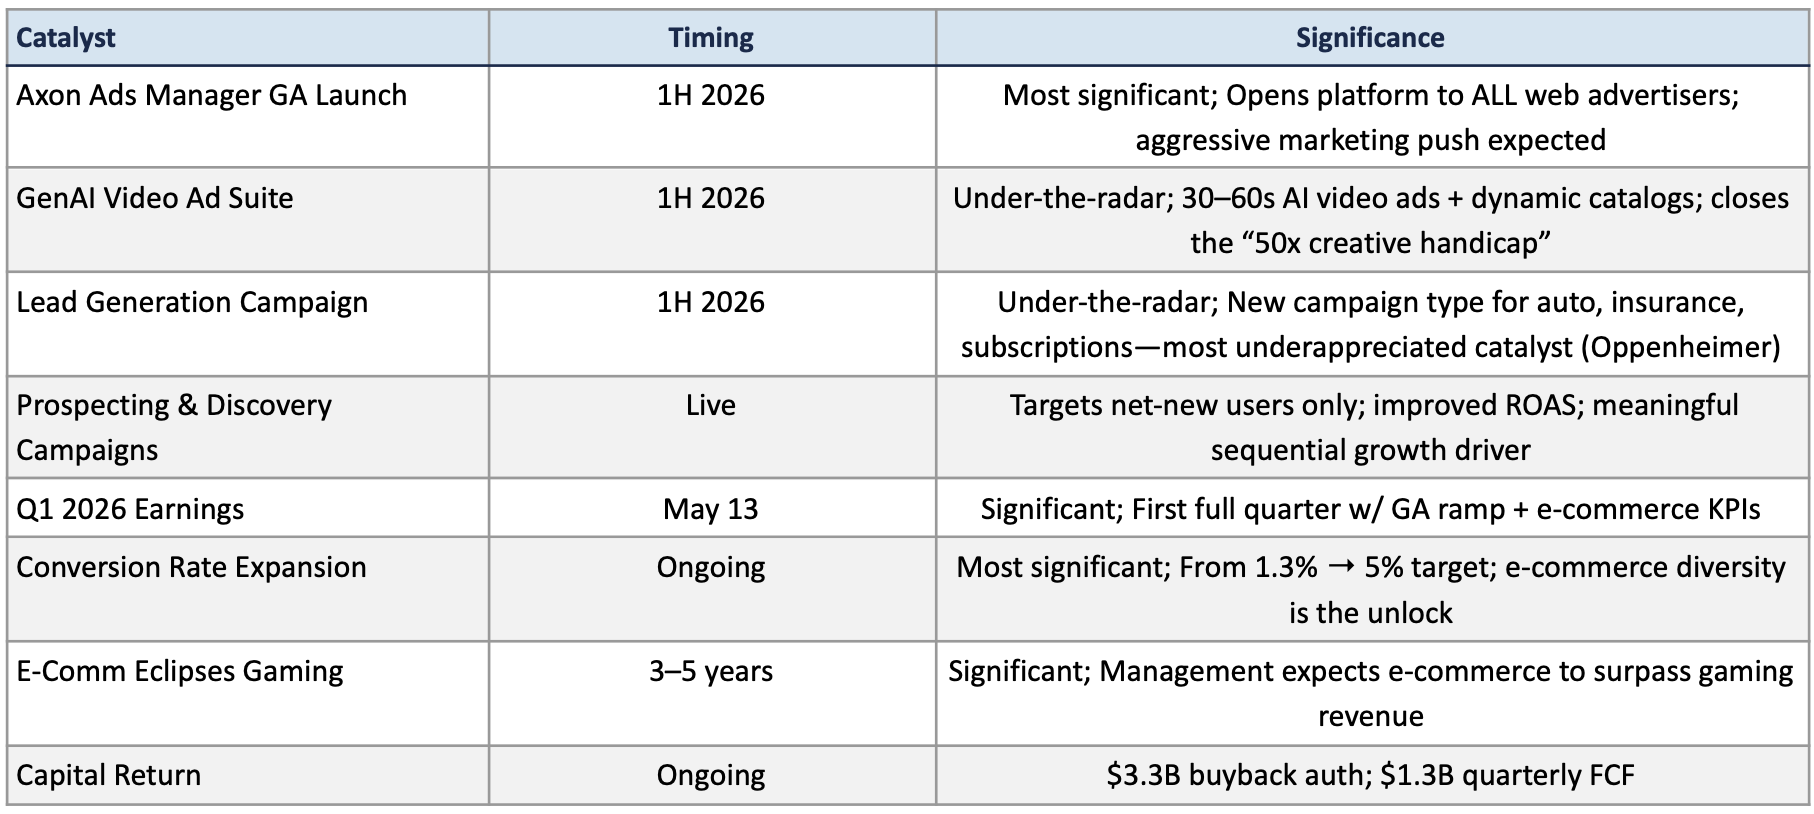
There are 4 demand-generation catalysts for 1H 2026 that can lead to multiple revision. First, Prospecting and Discovery Campaigns, released in November 2025 and February 2026 respectively, address the top requests from e-commerce advertisers by targeting first-time visitors and proving Axon’s incremental value. Second, AppLovin’s GenAI advertising suite is approaching maturity. APP is piloting multi-agent GenAI solutions for interactive pages with over 100 customers, testing static image generation with early success, and expects video AI models in 1H 2026 to be sophisticated enough to produce high-performing 15–30 second ads. Third, a forthcoming lead generation campaign type will move APP beyond mid-market e-commerce into high-value verticals like automotive, insurance, and subscription services, significantly broadening the addressable advertiser base. Fourth, the GA launch of Axon Ads Manager in 1H 2026 will open the platform to all web advertisers, giving brands autonomy to build tailored campaigns and coinciding with an aggressive marketing push.
Comparative Analysis
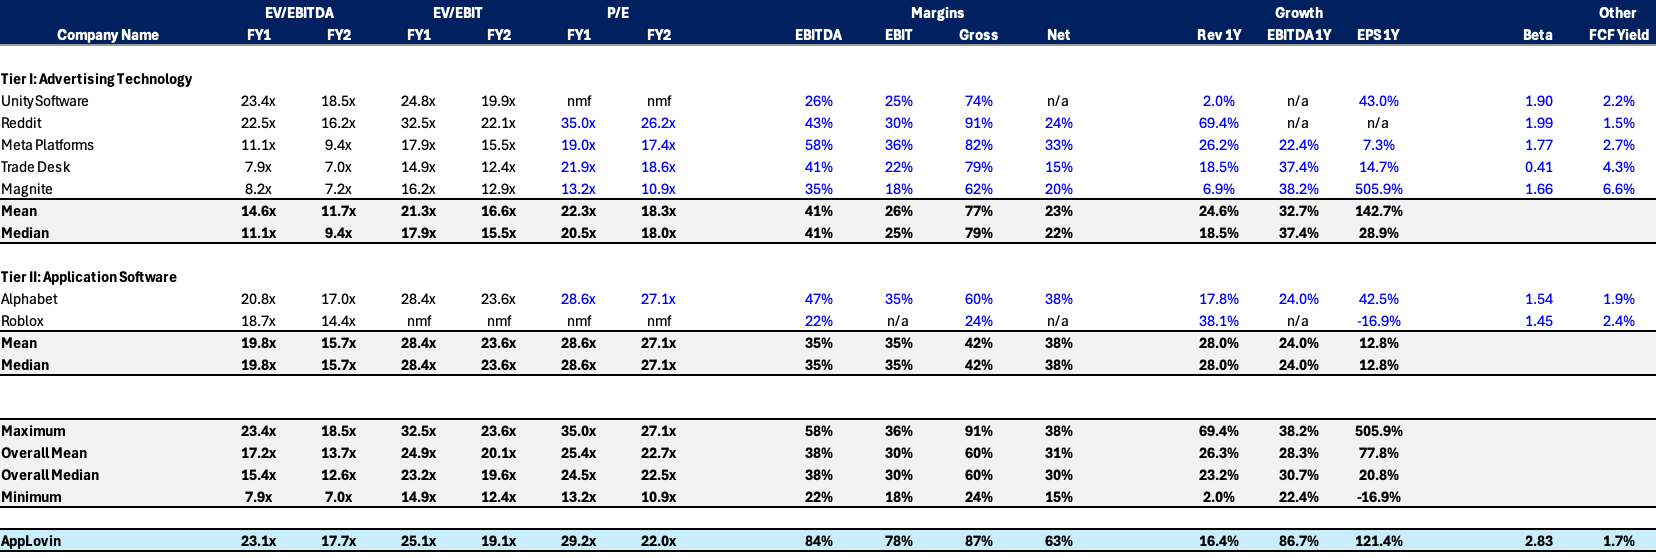
APP trades at a premium to ad-tech peers on trailing multiples but at a meaningful discount on a growth-adjusted basis. On a PEG-adjusted basis, APP’s forward EV/EBIT of approximately 25x against a 33% revenue CAGR through 2030 implies a PEG ratio of roughly 0.8x, a meaningful discount to application software peers like Palantir and CrowdStrike which trade at 1.5 to 2.5x PEG on materially lower growth profiles (although investors can argue that PLTR/CRWD has higher earnings stability). On a trailing EV/EBITDA basis, APP at approximately 23.1x sits above the ad-tech median but below Meta at 10.9x on an absolute basis when adjusting for growth. For a business delivering 47% topline growth with 84% EBITDA margins, the Rule of 130+ score places APP in a category of its own relative to the broader software universe. The current approximately 25x forward EV/EBIT effectively prices in structural deceleration to mid-20s growth, an outcome not supported by operating data, management guidance, or the e-commerce optionality now visible in third-party tracking data.
Valuation Football Field
What Would Change My View
EBITDA margins compressing below 80% for two consecutive quarters would suggest structural cost pressure rather than investment-phase spending and call into question the operating leverage embedded in my model.
Weakness in 3rd party channel (i.e. Citi Store Leads data, Triplewhale, Oxford, Cleveland, Northbeam) showing Axon client count plateauing below 10,000 by Q2 2026 would indicate the DTC product is failing to gain traction beyond early adopters, undermining the core growth thesis.
MAX mediation market share declining by more than 500 basis points as measured by Sensor Tower would suggest CloudX or Meta re-entry is having real competitive impact on the supply-side moat.
Management delaying the Axon Ads Manager GA launch beyond Q3 2026 would signal execution challenges with the self-serve platform that could push DTC revenue contribution into 2027.
Sequential gaming revenue growth turning negative for two consecutive quarters absent a macro-driven ad spending pullback would indicate the Axon 2.0 model improvement cycle is exhausting its runway earlier than expected.
Key Data to Monitor: Citi’s weekly Store Leads data for DTC progress, Q1 2026 earnings call on May 6 for DTC KPI disclosure and sequential gaming growth, and review SEC EDGAR filings for developments related to the ongoing data practices inquiry.
Key Risks
Macro and demand risk. A more severe or prolonged economic slowdown could compress mobile ad budgets and raise advertiser ROAS hurdles, slowing DTC cohort ramp and pressuring near-term topline growth even if margins remain resilient. Ad spending is among the first line items cut in a downturn, and APP’s premium multiple leaves limited room for growth disappointment.
Competitive risk. Meta’s re-entry into iOS in-app bidding is the most credible threat. While I believe this risk is overstated (see Thesis 1), Meta’s deterministic audience graph gives it a structural data advantage on opt-out IDFA traffic that Axon’s probabilistic model cannot fully replicate. Separately, if rival ad networks materially improve performance or subsidize pricing, APP’s auction economics could face take-rate pressure through lower win rates or greater revenue share to publishers. I would increase concern if Meta Audience Network’s fill rate within MAX exceeds 25% of total impressions.
Platform and regulatory risk. Platform-level policy changes from Apple or Google could impose new restrictions on measurement, targeting, or optimization practices, reducing the effectiveness of mobile performance advertising broadly and potentially shifting advantage toward first-party platforms. Loss or degradation of the critical data signals that power Axon’s optimization loop would directly impair advertiser ROI and break the compounding flywheel that underpins the entire business model. This risk is elevated in the DTC vertical, where web-based conversion tracking is inherently noisier than in-app install attribution. APP has historically navigated these transitions better than peers (Axon 2.0 was specifically designed for the post-IDFA environment), but future restrictions remain an asymmetric tail risk. Additionally, the SEC inquiry into data collection practices remains active and ongoing; any enforcement action or required changes to data practices could impair Axon’s targeting accuracy.